Candlestick Patterns
- Three Black Crows:
A bearish continuation/reversal pattern formed by three consecutive long bearish candles. Each candle closes lower than the previous, indicating sustained selling pressure.
- Three Inside Up / Down:
A three-candle pattern combining a Harami followed by confirmation. Represents a potential change in short-term price momentum.
- Three-Line Strike:
A four-candle pattern where three candles move in one direction, followed by a strong reversal candle. Indicates an abrupt shift in market sentiment.
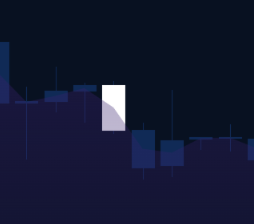
- Three Outside Up / Down:
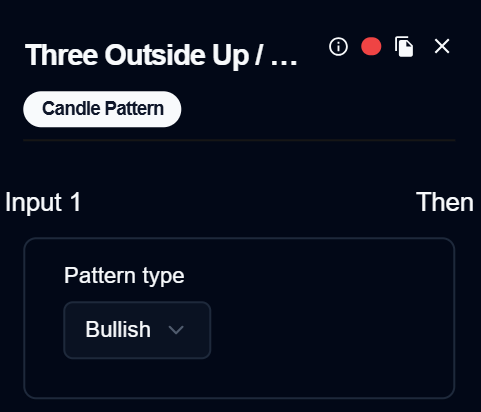
A three-candle pattern starting with an engulfing formation and confirmation. Shows expansion in price range and momentum shift.
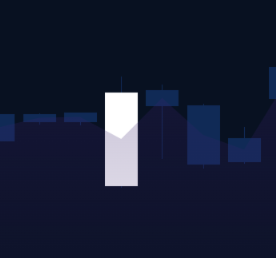
- Three Stars in the South:
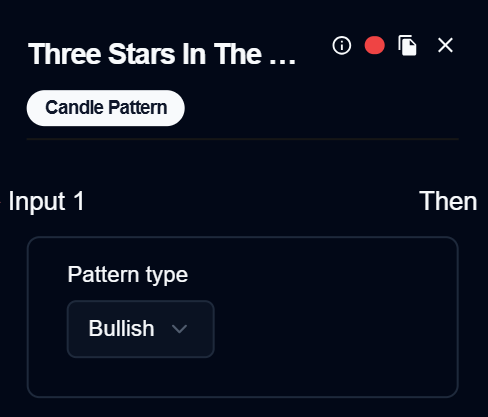
A rare three-candle bearish pattern with progressively smaller bodies. Suggests weakening downside momentum.
- Three Advancing White Soldiers:
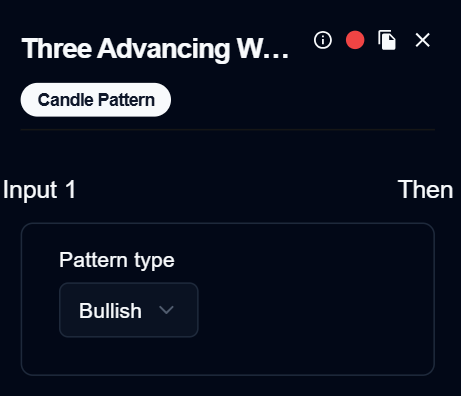
Three consecutive long bullish candles with higher closes. It represents a strong and steady upward price movement.
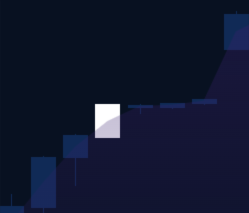
- Abandoned Baby:
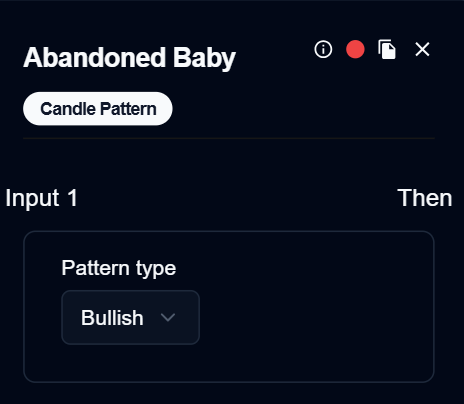
A three-candle pattern featuring a Doji separated by gaps on both sides. Indicates a sharp shift in market balance.
- Advance Block:
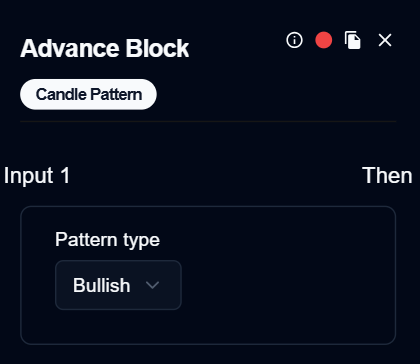
A bullish continuation pattern with weakening momentum. Successive candles show reduced strength despite higher closes.
- Belt-Hold:
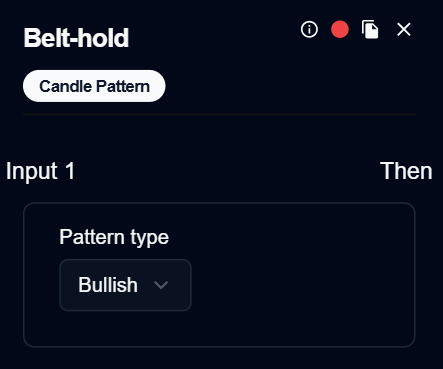
A single-candle pattern with a strong open and no opposite shadow. Reflects immediate dominance by one side of the market.
- Breakaway:
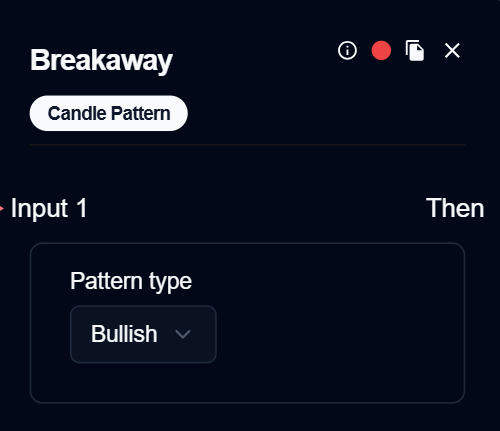
A five-candle pattern marked by a strong gap and continuation. Represents a decisive breakout from a prior range.
- Closing Marubozu:
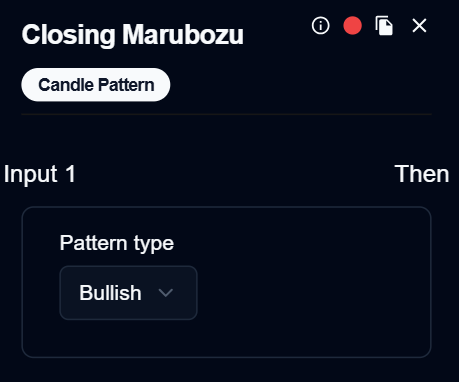
A candle that closes at its extreme with little or no shadow. Shows strong conviction in the session close.
- Concealing Baby Swallow:
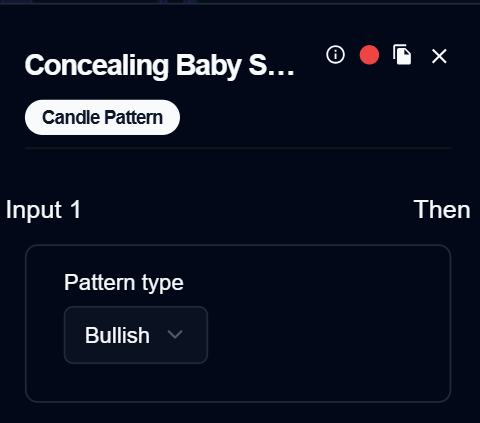
A rare four-candle bearish pattern involving marubozu candles. Signals exhaustion after aggressive price movement.
- Counterattack:
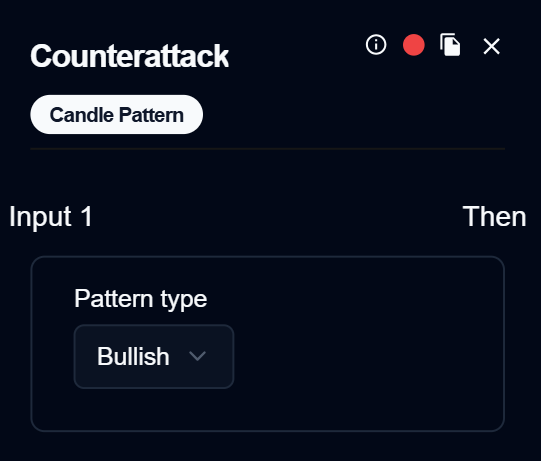
A two-candle pattern where the second candle closes near the first candle’s close. Shows the temporary balance after directional movement.
- Dark Cloud Cover:
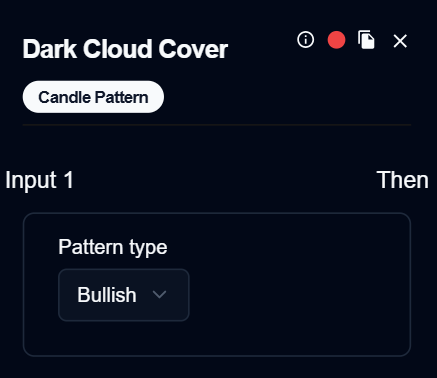
A two-candle bearish pattern where the price closes deep into the prior bullish candle. Indicates weakening upward momentum.
- Doji:
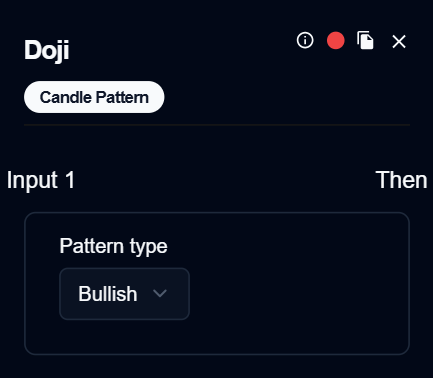
A candle where open and close prices are nearly equal. Represents market indecision or equilibrium.
- Doji Star:
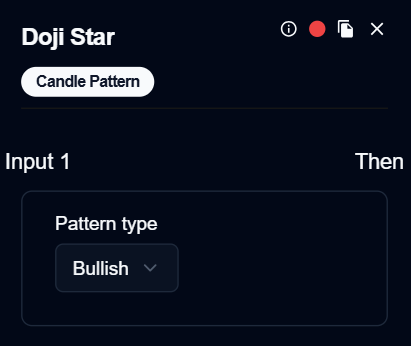
A Doji that gaps away from the prior candle. Highlights uncertainty following strong price movement.
- Dragonfly Doji:
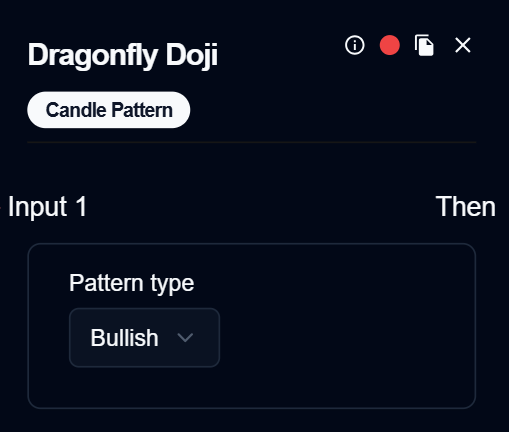
A Doji with a long lower shadow and no upper shadow. Indicates rejection of lower prices.
- Engulfing Pattern:

A two-candle pattern where the second candle fully engulfs the first. Shows a strong shift in control.
- Evening Doji Star:
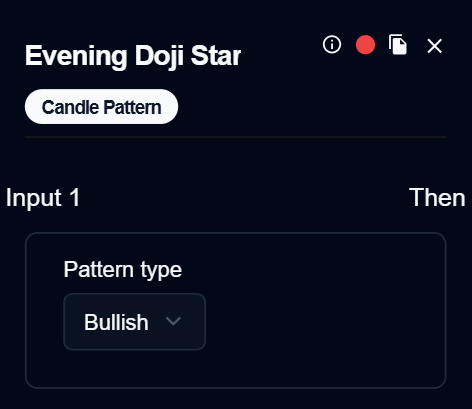
A three-candle pattern with a Doji between an up candle and a down candle. Represents a loss of upward momentum.
- Evening Star:
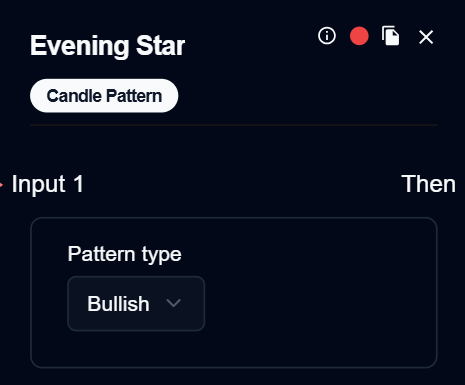
A three-candle reversal pattern after an uptrend. Shows transition from buying strength to selling pressure.
- Up/Down-Gap Side-by-Side White Lines:
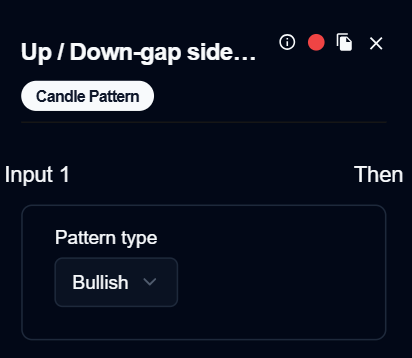
Two similar bullish candles appeared after a gap. Indicates continuation of the existing trend.
- Gravestone Doji:
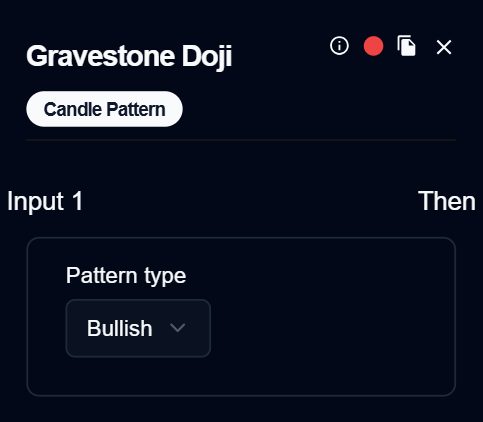
A Doji with a long upper shadow and no lower shadow. Reflects rejection of higher prices.
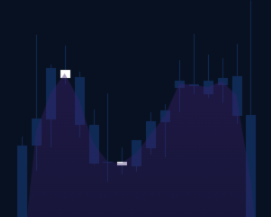
- Hammer:
A candle with a small body and a long lower shadow. Shows strong intraday price recovery.
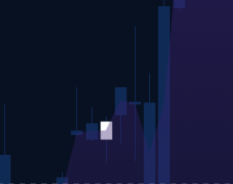
- Hanging Man:
A Hammer-like candle appears after an uptrend. Indicates potential weakening of upward momentum.
- Harami Pattern:
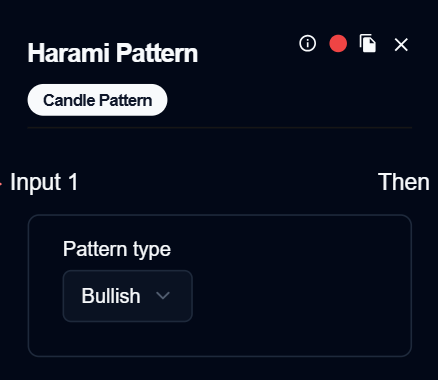
A two-candle pattern where the second candle is contained within the first. It represents a contraction in price movement.
- Harami Cross Pattern:
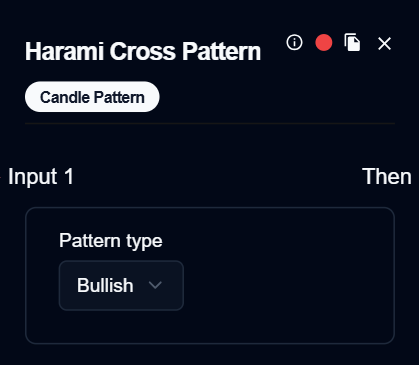
A Harami pattern where the second candle is a Doji. Emphasizes indecision following volatility.
- High-Wave Candle:
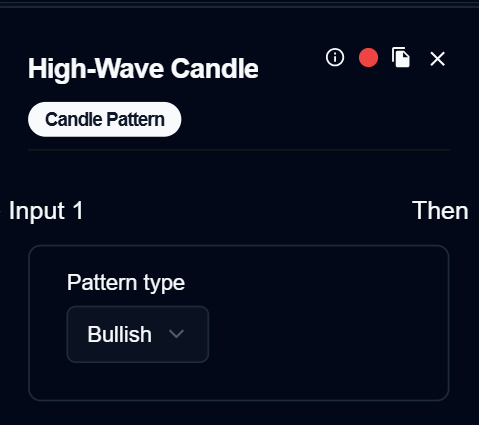
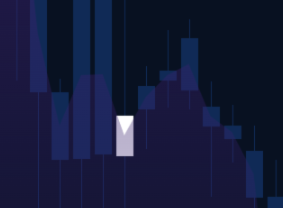
A candle with long upper and lower shadows. Shows high volatility and market uncertainty.
- Hikkake Pattern:
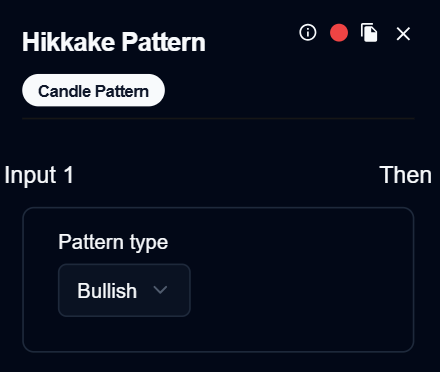
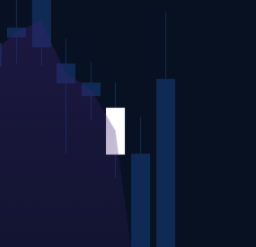
A false breakout pattern involving inside bars. Represents failed directional attempts.
- Modified Hikkake Pattern:
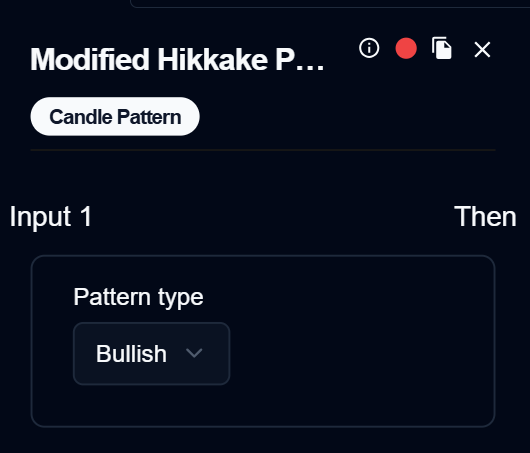
An extended version of the Hikkake with confirmation logic. Used to validate false breakout structures.
- Homing Pigeon:

A two-candle bearish pattern with a smaller candle inside a larger one. Indicates reduced downside momentum.
- Identical Three Crows:
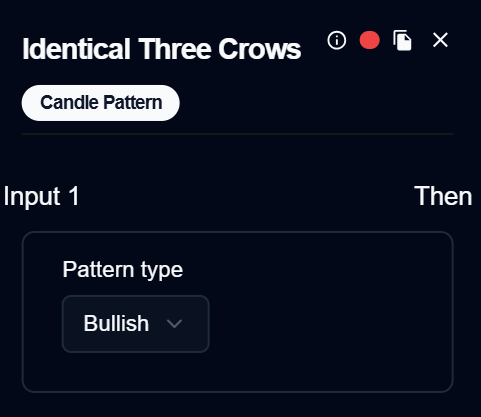
Three bearish candles closing at nearly the same level. Shows consistent selling pressure.
- In-Neck Pattern:

A two-candle bearish continuation pattern with limited recovery. Reflects weak buying response.
- Inverted Hammer:
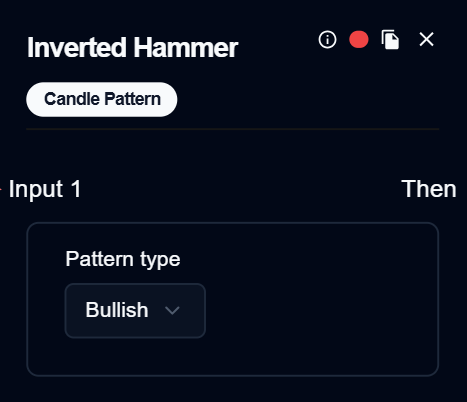
A candle with a small body and a long upper shadow. Shows upward price probing with rejection.
- Kicking:

A two-candle pattern formed by opposite marubozu candles with a gap. Represents a sudden and strong sentiment shift.
- Kicking (bull/bear by longer marubozu):
Variation where dominance is determined by candle length. Highlights strength imbalance.
- Ladder Bottom:
A five-candle pattern showing a gradual loss of downside momentum. Represents stabilization after a decline.
- Long-Legged Doji:
A Doji with very long shadows. Indicates extreme intraday volatility and indecision.
- Long Line Candle:
A candle with a long, real body. Shows strong directional movement.
- Marubozu:
A candle with no shadows. Represents full control by one side.
- Matching Low:
Two candles with similar lows. Indicates temporary price support.
- Mat Hold:
A bullish continuation pattern with consolidation candles. Represents orderly price digestion.
- Morning Doji Star:
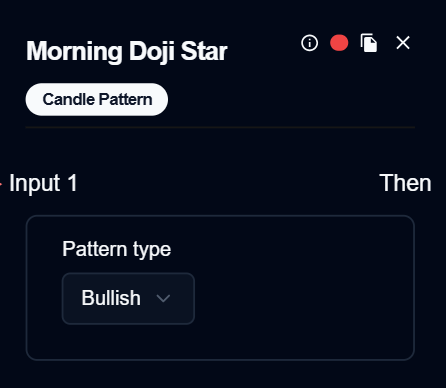
A three-candle pattern with a Doji between decline and recovery. Shows weakening downward pressure.
- Morning Star:
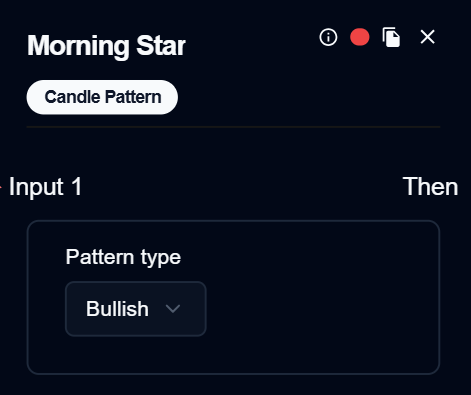
A three-candle reversal structure after a decline. Represents gradual momentum recovery.
- On-Neck Pattern:
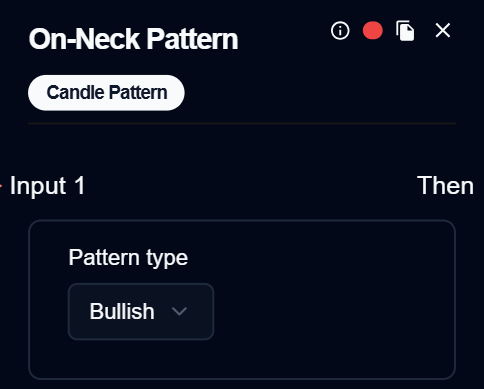
A bearish continuation pattern with limited retracement. Shows inability to reclaim lost ground.
- Piercing Pattern:
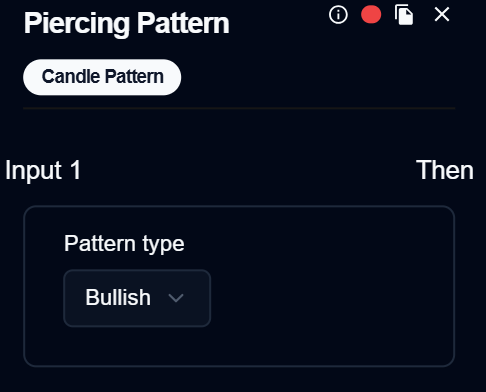
A two-candle pattern where the price recovers into the prior bearish candle. Indicates partial price recovery.
- Rickshaw Man:
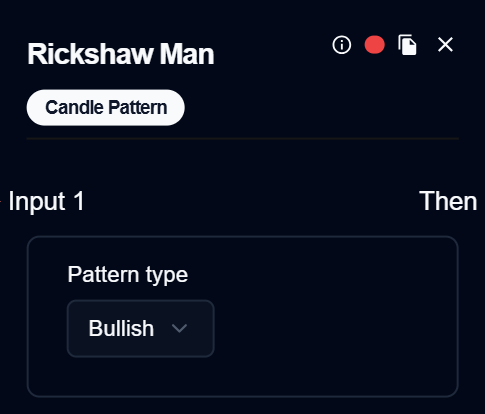
A Doji with long upper and lower shadows. Represents extreme indecision.
- Rising / Falling Three Methods:
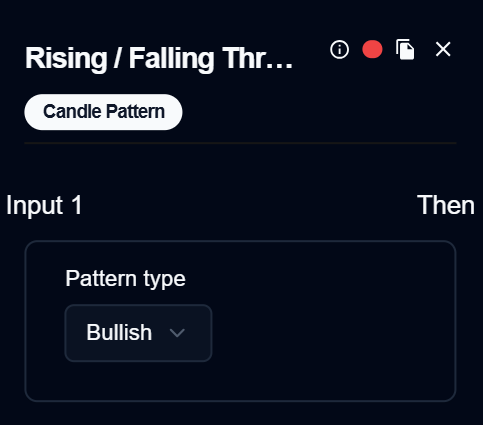
A five-candle continuation pattern with consolidation in between. Shows trend pause without reversal.
- Separating Lines:
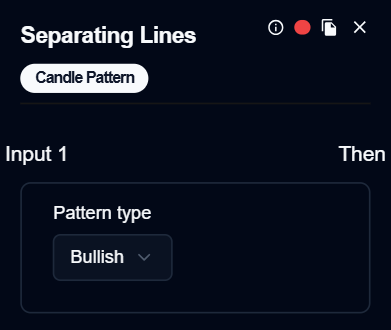
A two-candle continuation pattern sharing the same open. Indicates trend resumption.
- Shooting Star:
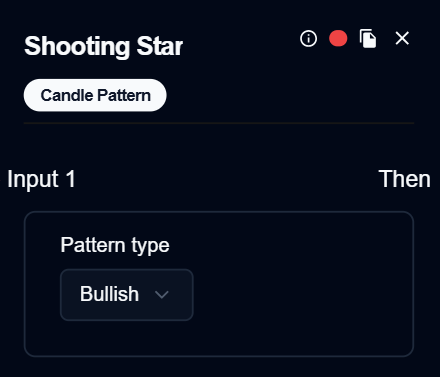
A candle with a small body and a long upper shadow. Shows rejection of higher prices.
- Short Line Candle:

A candle with a small body. Indicates reduced volatility.
- Spinning Top:
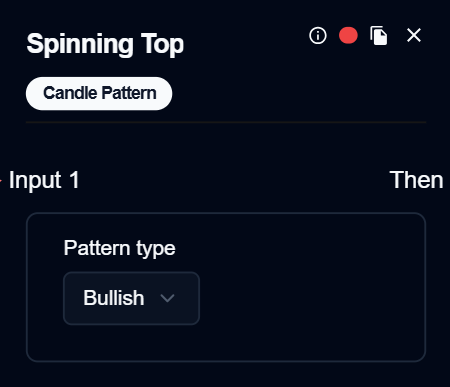

A candle with a small body and moderate shadows. Represents balance between buyers and sellers.
- Stalled Pattern:

A bullish pattern showing slowing upward momentum. Indicates hesitation near highs.
- Stick Sandwich:
Three-candle pattern with matching outer closes. Suggests price stabilization.
- Takuri:
A Dragonfly Doji with an extremely long lower shadow. Represents strong rejection of lower prices.
- Tasuki Gap:
A three-candle continuation pattern involving a gap and partial fill. Shows trend persistence.
- Thrusting Pattern:
A bearish continuation pattern with shallow recovery. Indicates weak buying interest.
- Tristar Pattern:
Three consecutive Doji candles. Represents prolonged indecision.
- Unique 3 River:

A rare three-candle bullish pattern after a decline. Shows loss of selling pressure.
- Upside Gap Two Crows:
A bearish pattern following an upside gap. Indicates failure to sustain higher prices.
- Upside / Downside Gap Three Methods:
Continuation pattern involving gaps and consolidation. Represents controlled trend progression.
- Two Crows:
A three-candle bearish pattern following an uptrend. Shows early signs of selling pressure.