Test Strategy Performance
This section provides a consolidated view of strategy activity, execution, and recent performance metrics. It serves as a central hub for tracking the creation, testing, and deployment of strategies across the platform.
1. Development & Activity Metrics
These indicators reflect the overall volume of strategy creation and the intensity of historical validation.
- Total Backtests: Represents the total number of backtests run across all strategies. Each backtest evaluates a strategy’s historical performance using past market data to simulate behavior under previous market conditions.
- Total Strategies Created: The cumulative count of strategies on the platform, encompassing drafts, unpublished versions, and deployed systems. This is a primary indicator of development activity.
- Total Strategies Published: The number of strategies that have been finalized and made available for deployment or sharing.
- Action: Clicking this value navigates directly to the Deployments / Published Strategies page.
2. Deployment & Adoption
These metrics track the transition from development to live market environments and user engagement.
| Metric | Description | Shortcut |
|---|---|---|
| Deployments | Displays the number of active or completed strategy deployments. | Redirects to Deployments Page |
| Total Copiers | Indicates the number of users or accounts currently copying published strategies, reflecting platform adoption. | - |
| Trades Executed | The total volume of trades generated by deployed strategies (includes both live and simulated environments). | - |
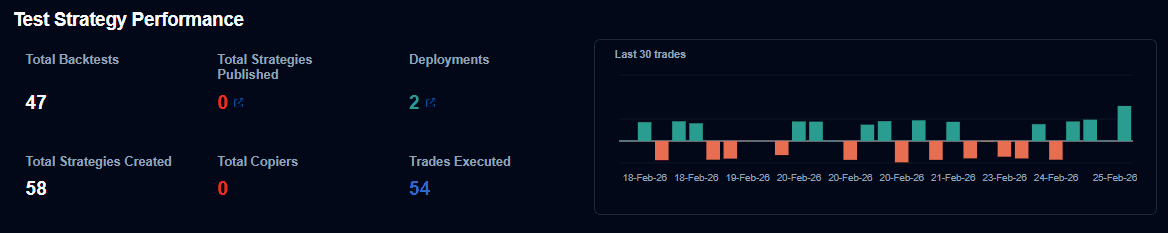
3. Performance Visualization
Last 30 Trades (Performance Chart)
This chart provides a high-level visual summary of the most recent execution outcomes, identifying winning or losing streaks at a glance.
- Positive Bars: Represent profitable trades.
- Negative Bars: Represent losing trades.
- Horizontal Axis: Displays the specific trade execution date.
Note: Performance data reflects the execution configuration of each deployment. Always verify if a trade was executed in a Live or Simulated environment when reviewing these metrics.
Navigation Tip
The Strategy Performance dashboard is interactive. Use the clickable metric cards to jump directly into the management interface for specific deployments or published scripts.