Create – Strategy Builder Feature Guide
Welcome to Create, the visual workspace where you can design, test, and deploy automated trading strategies without writing a single line of code. By combining indicators, logic blocks, and execution actions on a drag-and-drop canvas, you can transform your trading ideas into a systematic reality.
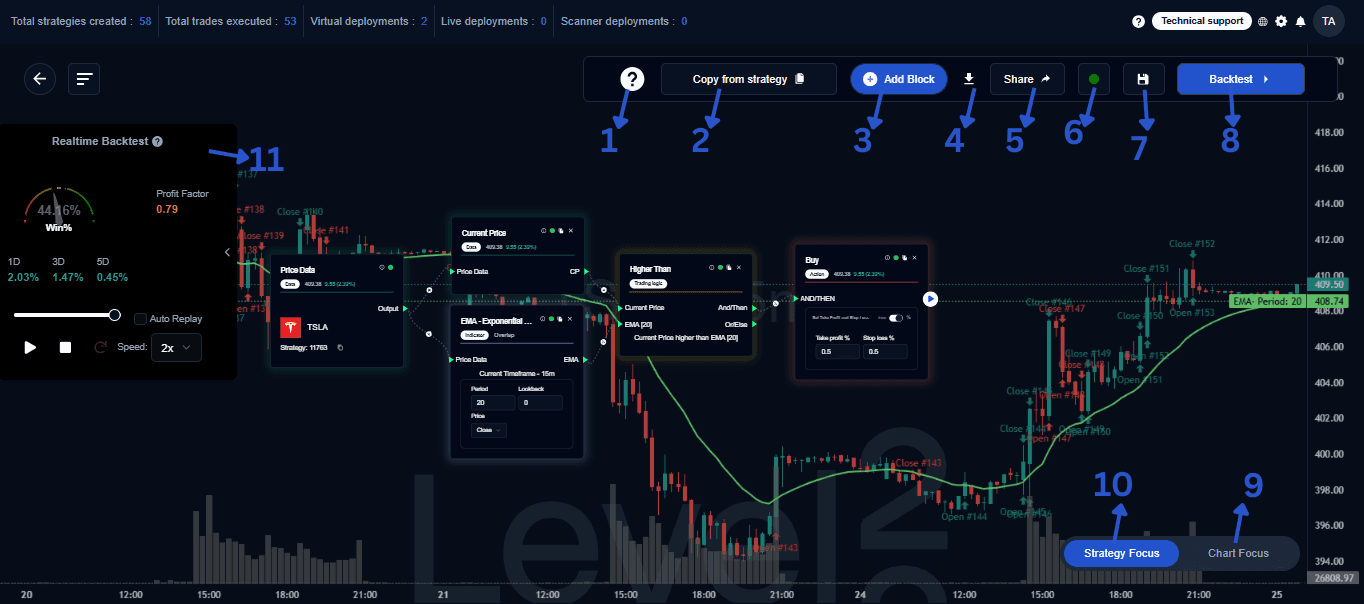
1. Unleash Your Trading Power
Create lets you build fully automated trading strategies with a simple visual interface.
- Design: Add indicators, logic, and actions to the canvas.
- Test: Backtest strategies instantly against historical data.
- Deploy: Send your strategies to live servers for high-speed execution.
2. Copy From Strategy
Reuse what already works. You can duplicate an existing strategy to clone its:
- Indicators and parameters
- Logic blocks and connections
- Execution actions
This is the fastest way to apply a proven setup to a new asset, a different timeframe, or to iterate on a modified version of a successful idea.
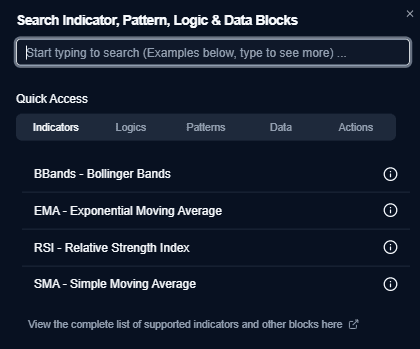
3. Add Blocks & Build Logic
The Add Block menu is your toolbox for defining how your strategy “thinks.”
- Indicators: SMA, EMA, RSI, VWAP, Bollinger Bands, etc.
- Pattern: Identify specific candlestick or chart patterns.
- Logic Blocks: Define triggers like Crosses Above, Higher Than, or Decreases By.
- Data Blocks: Input variables such as Price, Volume, or fixed Numbers.
- Action Blocks: Component of a strategy that defines the specific trading action to execute.
- Scanners: Designed to help traders quickly identify high-potential trading opportunities without constant market monitoring.
4. Documentation
- Download Strategy Image: Export a high-resolution image of your canvas. You can choose to include or hide specific parameters—perfect for strategy reviews or presentations.
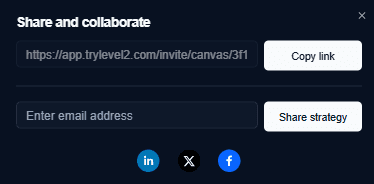
5. Sharing
- Share & Collaboration: Work together easily by copying a public link or inviting collaborators via email.
6. System Status
- 🟢 Strategy Status Indicator: A Green Dot confirms your strategy is logically complete and ready for testing.
- 🔴 Strategy Status Indicator: A Red Dot indicates missing connections or incomplete parameters.
7. Save Strategy
- Save Strategy: Preserve your progress, track different versions, and ensure your logic is safely stored on the cloud.
8. Backtest
Running a backtest helps you quantify three essential aspects of your strategy:
Profitability
- Net Return: Understand the total profit or loss generated over a specific period.
- Profit Factor: Measure the ratio of gross profit to gross loss. A value above 1.0 indicates a profitable system.
- Win Rate: See the percentage of trades that resulted in a positive outcome.
Risk Assessment
- Maximum Drawdown: Identify the largest peak-to-trough decline in your capital. This helps you understand the “worst-case scenario” you might face.
- Risk-Reward Ratio: Evaluate if the potential gains are worth the risks being taken on each trade.
- Volatility Handling: See how your strategy behaves during high-volatility events or sudden market crashes.
Trade Behavior
- Entry/Exit Accuracy: Inspect individual trades on the chart to ensure the strategy is triggering exactly where your logic intended.
- Trade Frequency: Determine whether your strategy trades too often (overtrading) or too rarely, as this can affect commission costs and capital utilization.
- Holding Time: Analyze the average duration of each trade to see if it aligns with your trading style (e.g., scalping vs. swing trading).
9 & 10. Visualization Modes
Depending on your current task, you can toggle between two primary views:
| View Mode | Focus | Best For |
|---|---|---|
| Strategy Focus | Logic Blocks & Flow | Editing, debugging, and explaining the “brain” of the strategy. |
| Chart Focus | Price Action & Indicators | Analyzing candlestick patterns, trendlines, and trade entry/exit markers. |
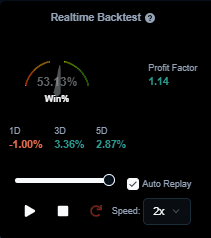
11. Performance & Validation
- Backtest Strategy: Run a comprehensive simulation to understand historical profitability, risk profile, and trade frequency.
- Real-Time Metrics: Get an instant snapshot of performance directly on the builder screen.
- Win %: The percentage of profitable trades.
- Profit Factor: The ratio of gross profit to gross loss.
Tip: Start with the Strategy Focus View to build your logic, then switch to Chart Focus to see exactly how those rules would have triggered trades during recent price action.