RSI Momentum Confirmation
Strategy Overview
The RSI Momentum Confirmation strategy is a rule-based system designed to capture early-stage bullish momentum. Instead of trying to pick a market bottom, this strategy waits for a mathematical confirmation that buyers are regaining control.
By entering only when the RSI crosses above a specific threshold, the strategy filters out “dead” price action and focuses on assets that are actively gaining strength.
Indicators Used
| Component | Function |
|---|---|
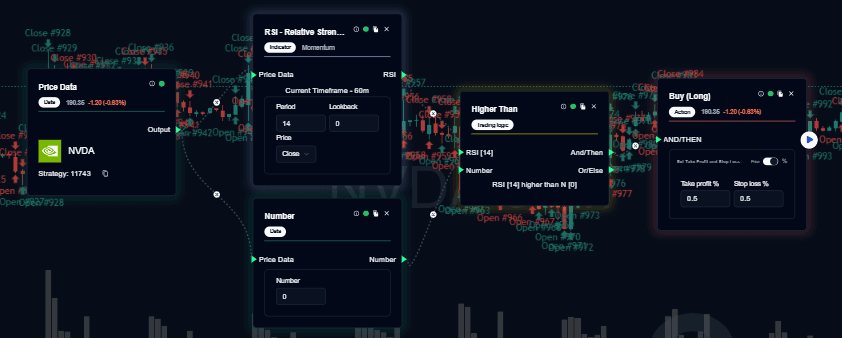
| Price Data | Uses the Closing Price to ensure calculations are based on finalized market movement rather than temporary spikes. |
| RSI (14) | The core momentum oscillator. It measures the speed and change of price movements on a scale of 0 to 100. |
| Threshold Value | A customizable “trigger” level (e.g., 40 or 50). This serves as the line in the sand for momentum validation. |
| Logic (Higher Than) | The computational engine that compares the current RSI against the threshold to confirm a shift. |
Trading Logic
Entry Logic (Long)
A Long (Buy) trade is triggered when the following sequence is validated:
- Calculation: The RSI is derived from the most recent closing price data.
- Comparison: The system checks whether the current RSI value is higher than the selected threshold.
- Confirmation: Once the RSI sustains a position above the threshold, momentum is considered confirmed.
- Action: A Buy order is executed immediately.
Exit Logic (Recommended)
To maintain a healthy risk-to-reward ratio, the strategy can be paired with:
- Hard Stop-Loss: Placed below recent swing lows to protect capital.
- Momentum Exit: Closing the trade if RSI falls back below the threshold.
- Fixed Take-Profit: Exiting at a predetermined price target or percentage gain.
Strategy Behavior & Benefits
- Late-Stage Filter: Avoids “catching a falling knife” by requiring price strength before entry.
- Intraday Reliability: Effective for scalping or day trading where momentum shifts are frequent.
- Objectivity: Removes emotional bias by providing a clear, numerical signal for entry.
- Clean Structure: Uses minimal indicators to reduce chart clutter and lag.
Market Applicability
✅ Best Used In
- Trending Markets: To join a move that has already started.
- Pullback Recovery: Identifying the exact moment an uptrend resumes after a temporary dip.
- High Liquidity: Best performed on Stocks, Indices, and major Crypto pairs.
❌ Avoid Using In
- Choppy/Sideways Markets: Where price oscillates around the threshold, causing “whipsaws.”
- Strong Downtrends: RSI may briefly cross a low threshold (like 30) only to be rejected as the crash continues.
- Illiquid Assets: Where low volume causes erratic RSI jumps.
Note: This documentation is for structural recognition and analytical purposes only. It does not constitute financial advice.
Last updated on