Frequently Asked Questions
In a scenario where a strategy is deployed at 7:00 AM with the Time Switch set from 15:30 to 09:45, when does the configuration take effect?
In a scenario where a strategy is deployed at 7:00 AM with the Time Switch set from 15:30 to 09:45, when does the configuration take effect?
The configuration takes effect immediately on the same day.
Explain Perpetual Crypto Contracts?
Explain Perpetual Crypto Contracts?
Perpetual Contracts (Perpetual Swaps)
Perpetual contracts are agreements to buy and sell assets unconditionally at a specific time in the future, settled exclusively in cash. Unlike traditional futures, they have no pre-specified settlement date, so they can be held indefinitely without rollover.
Key Characteristics
Perpetual contracts function as a type of swap because cash flows are regularly exchanged between buyers and sellers.
- Profit/Loss Calculation: Gains or losses are calculated based on the difference between the initial trading price and the index price.
- Leverage: Results are usually magnified by leverage, which in the crypto market can sometimes exceed 100 times the margin.
- Market Structure: Similar to a Contract for Difference (CFD), but traded on exchanges where contract specs (margin, leverage, settlement) are uniformly stipulated rather than negotiated over-the-counter with a broker.
Risk Management Mechanisms
Due to high leverage, exchanges implement several mechanisms to maintain system stability.
Insurance Funds & Liquidations
- Insurance Funds: Introduced to prevent the triggering of automatic deleveraging. These funds primarily come from the remaining margin after a trader’s position is liquidated.
- **Loss
What is trading on Margin?
What is trading on Margin?
A Simple Guide to Trading on Margin and Short Selling
Margin trading allows you to trade securities with a value that exceeds your account cash balance, as the funds are loaned to you with a standard limit of 2x buying power. This leverage can amplify both potential returns and risks.
How Margin Works
By using margin, an account holding $10,000 in cash may purchase and hold up to $20,000 in securities overnight. Essentially, you are borrowing against your existing capital to increase your market exposure.
Margin Requirements
Initial Margin
The initial margin is the percentage of the trade price that a trader must pay from available cash when the trade is opened.
- Requirement: There is a minimum initial margin requirement of 50% for marginable securities.
- Example: For a position size of $10,000, an initial margin of $5,000 is required.
Maintenance Margin
The maintenance margin is the amount of cash or securities required to continue holding an open position. In the US, FINRA sets these minimums based on the price and total market value of the securities.
| Position | Condition | Margin Requirement |
|---|---|---|
| Long | Share price < $2.50 | 100% of EOD market value |
What is Drawdown Simulation?
What is Drawdown Simulation?
What is Monte Carlo Simulation?
The Monte Carlo simulation is a statistical technique that introduces randomness into the test dataset to enable more accurate risk analysis.
- The Process: It reshuffles the order of historical trades based on the premise that it is unlikely an asset will perform exactly the same in the future as it did in the past.
- The Goal: By analyzing the best, worst, and average outcomes of these reshuffled sequences, a trader can detect misleading performance metrics and better understand potential future performance.
Understanding Drawdown
Drawdown is a primary measure of downside volatility, showing the decline from a peak before a new peak is reached.
- Risk Indicator: Drawdown shows how much a strategy is down from its highest point before it recovers.
- Volatility Correlation: Generally, the larger the drawdown, the larger the up and down swings in your strategy, indicating a high-risk and high-volatility approach.
- Risk Tolerance: Measuring drawdown helps traders evaluate if a strategy aligns with their personal risk tolerance and trading style.
Why Run a Drawdown Simulation?
Standard backtesting only shows you one possible path. A drawdown simulation provides a spectrum of possibilities:
| Outcome Type | Benefit for the Trader |
|---|---|
| Worst-Case Scenario | Helps you prepare for the maximum possible “pain” or capital loss the strategy might experience. |
| Average Outcome | Provides a realistic expectation of performance over hundreds of simulated trials. |
| Luck Detection | Identifies if your backtest results were simply due to a favorable sequence of trades that is unlikely to repeat. |
Practical Application
When reviewing your strategy statistics, look for the Monte Carlo or Drawdown simulation tab to see how your equity curve behaves under stress.
- Check the “Max Drawdown”: If the simulation shows a drawdown significantly higher than your initial backtest, you may need to adjust your position sizing.
- Analyze Recovery Time: See how long the strategy stays in a “trough” across different randomized sequences to ensure you have the patience to stick with the plan.
How do I get started with the Cross-Over Scanner?
How do I get started with the Cross-Over Scanner?
What types of Cross-Overs can the Scanner identify?
What types of Cross-Overs can the Scanner identify?
Explain Hedging vs Netting for CFD trading
Explain Hedging vs Netting for CFD trading
Order Management Systems
Whenever a new order is opened for an instrument with an existing open position, the impact on your overall exposure depends on how the broker manages the orders. There are two primary methods: Netting and Hedging.
Important Note: The Level2 application operates on a Netting basis only. Each strategy can have only one action block, with either a sell or a buy order, ensuring trades are always in the same direction.
Netting Method
The Netting approach consolidates all trades for a specific instrument into a single position. This is highly suitable for automated trading and high volumes as it simplifies risk management and reduces operational costs.
- Single Position: Only one position can be open in any direction for one specific instrument at a time.
- Volume Aggregation: If you have a buy order of 1 lot and open another buy order of 2 lots, you will have one position with a total volume of 3 lots.
- Price Averaging: In the case of multiple orders in the same direction, the entry price is averaged.
- Position Reversal/Closing:
- Opening an equal and opposite order closes the position (e.g., +1 buy and -1 sell = 0).
- Opening a larger opposite order reverses the position (e.g., +1 buy and -3 sell = -2 sell).
Hedging Method
The Hedging method allows a trader to hold multiple open positions in different directions for the same instrument simultaneously.
- Multiple Positions: You can choose to have as many open positions as you like, even in opposing directions.
- Independent Execution: If you open a 1 lot buy and then a 1 lot sell, both remain open independently rather than canceling each other out.
- Price & Volume Integrity: Every new position is treated as a separate order with its own price and volume, and they can be closed in any order at any time.
Comparison Summary
| Feature | Netting (Level2 Standard) | Hedging |
|---|---|---|
| Position Count | Max 1 per instrument | Multiple |
| Opposite Orders | Closes or reduces position | Creates a new separate position |
| Entry Price | Weighted average of all entries | Unique to each individual order |
| Suitability | Automated trading / High volume | Discretionary / Complex hedging strategies |
Key Takeaway
Netting simplifies your trading activities by consolidating risk into a single data point. Since Level2 uses this method, ensure your strategy logic accounts for the fact that a “Sell” signal while in a “Buy” position acts as a close or reversal command.
What is a Cross-Over Scanner?
What is a Cross-Over Scanner?
What is a Momentum Scanner?
What is a Momentum Scanner?
What is a Harmonic Pattern Scanner?
What is a Harmonic Pattern Scanner?
How accurate are Harmonic Pattern Scanners?
How accurate are Harmonic Pattern Scanners?
How does the Harmonic Pattern Scanner work?
How does the Harmonic Pattern Scanner work?
What Harmonic Patterns does the Scanner identify?
What Harmonic Patterns does the Scanner identify?
What is a Chart Pattern Scanner?
What is a Chart Pattern Scanner?
How does the Chart Pattern Scanner work?
How does the Chart Pattern Scanner work?
Why use a Chart Pattern Scanner? What are the benefits?
Why use a Chart Pattern Scanner? What are the benefits?
What are the best practices for maintaining strategy robustness and performance longevity in dynamic financial markets?
What are the best practices for maintaining strategy robustness and performance longevity in dynamic financial markets?
1. Understand Market Regimes
- Types of Market Conditions: Markets can trend, range, or experience high/low volatility. A strategy optimized for a trending market may perform poorly in a ranging market.
- Detecting Regime Shifts: Use tools like the Average True Range (ATR), Bollinger Bands, or moving average crossovers to identify changes in volatility or trends.
2. Monitor Strategy Performance
- Regularly review performance metrics like win rate, profit factor, Sharpe ratio, and drawdown.
- Watch for declining performance over time, which could indicate that the market environment no longer suits your strategy.
3. Incorporate Robustness Testing
- Test your strategies in different market environments during backtesting (e.g., bull, bear, and high/low volatility).
- Simulate adverse conditions (stress testing) to ensure your strategy can survive extreme market moves.
4. Use Adaptive Indicators
Replace static parameters with adaptive ones to maintain accuracy:
- Use an ATR-based trailing stop instead of a fixed point stop.
- Adjust moving average lengths based on current market volatility.
- Consider modern indicators like the Kaufman Adaptive Moving Average (KAMA).
5. Diversify Your Strategies
Avoid over-reliance on a single strategy.
- Pair a trend-following strategy with a mean-reversion strategy to capture opportunities in varying environments.
6. Set Alerts for Key Metrics
- Automate alerts for when performance falls below thresholds (e.g., prolonged drawdowns).
- Use these alerts as signals to evaluate or pause the strategy.
7. Incorporate Market Sentiment and News
- Monitor fundamental factors like earnings reports, central bank announcements, or geopolitical events.
- Pair sentiment indicators (like the VIX) with your technical indicators to anticipate potential shifts.
8. Automate Strategy Adaptation
Use conditional logic (like in Level2) to switch strategies automatically:
- Volatility Spike: If ATR increases, switch from mean-reversion to breakout logic.
- Market Consolidation: If moving averages flatten, pause trend-following strategies.
9. Regularly Reevaluate and Optimize
- Conduct monthly or quarterly reviews.
- Avoid over-optimization (curve fitting); aim for general strategies that work across various conditions.
10. Know When to Pause
- Preserving capital is as important as making profits.
- Pause trading during uncertain or extreme market conditions (e.g., black swan events).
Conclusion
Adapting to changing markets requires vigilance, flexibility, and continuous improvement. By incorporating these practices into your workflow, you can ensure your strategies remain relevant and effective over time.
What are some of the Pitfalls and missteps to avoid when creating automated strategies?
What are some of the Pitfalls and missteps to avoid when creating automated strategies?
Creating an automated trading strategy using technical indicators and pattern recognition can be powerful, but many traders fall into common pitfalls that can compromise the strategy’s effectiveness. Below are the most significant mistakes to monitor.
1. Data and Testing Errors
Overfitting to Historical Data
- Problem: Optimizing a strategy too much for past data (curve fitting) can lead to poor performance on new, unseen data.
- Example: Designing a strategy that perfectly catches every peak and trough in historical data but fails in live markets because patterns don’t repeat exactly.
- Solution: Understand the specific market regime (strong/weak bullish, bearish, or neutral/range-bound) your strategy was created for.
Using Infrequent or Incomplete Data
- Problem: Backtesting with low-quality or incomplete data can lead to false conclusions.
- Example: Backtesting on daily data without considering intraday price fluctuations or gaps.
- Solution: Use high-quality, granular data (tick or minute-level) and account for missing data or outliers.
2. Strategy Design Flaws
Ignoring Market Context
- Problem: Using indicators or patterns without understanding the current market regime.
- Example: Applying trend-following indicators like Moving Averages in sideways markets, resulting in “whipsaw” losses.
- Solution: Add market regime filters or complementary strategies that adapt to different conditions.
Indicator Overload
- Problem: Stacking multiple redundant indicators (e.g., RSI and Stochastics) creates noise and analysis paralysis.
- Example: Adding multiple oscillators and trend indicators that give conflicting signals.
- Solution: Focus on a few non-redundant indicators where each adds unique value.
3. Risk and Execution Realities
Lack of Proper Risk Management
- Problem: Ignoring position sizing and drawdown control can lead to catastrophic losses.
- Example: A strategy that wins often but has one or two massive losses that wipe out the account.
- Solution: Incorporate risk controls, such as max loss per trade, max drawdown limits, and position-sizing rules.
Failing to Account for Execution Costs
- Problem: Ignoring transaction costs, slippage, and latency can make a profitable strategy unviable.
- Example: A scalping strategy that looks great in backtesting but loses money in live trading due to high transaction costs.
- Solution: Simulate real-world trading conditions and account for all costs when backtesting.
4. Operational and Behavioral Risks
| Pitfall | Problem | Solution |
|---|---|---|
| Asset Correlation | Trading multiple assets with similar strategies without accounting for their correlations. | Analyze correlations and diversify assets to reduce systemic risk. |
| Post-Deployment Neglect | Assuming a strategy will work forever without regular updates or monitoring. | Continuously monitor and tweak the strategy as market conditions evolve. |
| Emotional Interference | Overriding the automated system due to fear, greed, or overconfidence. | Trust the system and stick to the rules to avoid emotional decision-making. |
| Lack of Understanding | Using indicators or patterns without understanding their underlying logic or assumptions. | Study how each indicator behaves in different market conditions (e.g., volatility expansions). |
Key Takeaway
Historical patterns are a guide, not a guarantee. Combine patterns with quantitative filters and robust risk management to ensure your strategy can survive live market dynamics.
What are the Psychological Biases to avoid when creating automated trading strategies?
What are the Psychological Biases to avoid when creating automated trading strategies?
Even though automated trading removes emotional decision-making from individual trades, psychological biases still influence strategy design, optimization, and execution. Understanding these biases is critical for developing robust, long-term systems.
1. Common Psychological Biases
Overfitting Bias (Curve Fitting)
- What it is: Modifying a strategy excessively so that it performs well on past data but fails in live trading.
- Example: Optimizing parameters until a backtest has a 90% win rate, only for the strategy to collapse in real-time because it was tuned to past noise.
- How to Avoid: Use out-of-sample testing, perform walk-forward testing, and keep strategy rules simple and logical.
Survivorship Bias
- What it is: Ignoring stocks or instruments that failed in the past, leading to an unrealistic view of performance.
- Example: Backtesting a momentum strategy only on currently listed stocks without including delisted ones.
- How to Avoid: Use data that includes delisted stocks and test on a broader, unbiased dataset.
Look-Ahead Bias
- What it is: Using future data in a backtest that wouldn’t have been available at the time of trading.
- Example: A strategy triggering an entry based on the day’s closing price before the market has actually closed.
- How to Avoid: Ensure signals only use information available at the time of the decision and validate that no future data leaks into the backtest.
Confirmation & Anchoring Bias
- Confirmation Bias: Favoring data that confirms pre-existing beliefs, such as ignoring evidence that a favorite indicator is ineffective.
- Anchoring Bias: Relying too heavily on initial information, like assuming a strategy is perfect based solely on the very first backtest.
2. Emotional Biases in Execution
Gambler’s Fallacy
- What it is: Believing that past outcomes affect future probabilities in a way they don’t.
- Example: Assuming that after five losing trades, the next one is “due” to be a winner.
- How to Avoid: Recognize that each trade is independent and rely on statistical models rather than intuition.
Loss Aversion & FOMO
- Loss Aversion: Stopping a strategy too early after a few losses instead of allowing the statistical edge to play out.
- FOMO (Fear of Missing Out): Modifying a strategy to enter trades prematurely based on recent large market moves.
3. How to Overcome Biases
To maintain a data-driven approach, traders should implement the following structural habits:
| Strategy | Actionable Step |
|---|---|
| Robust Backtesting | Use out-of-sample and walk-forward testing to ensure logic holds up. |
| Diversification | Don’t rely on just one approach; use multiple uncorrelated strategies. |
| Full Automation | Reduce manual intervention to prevent emotions from overriding the system. |
| Metric-Based Analysis | Analyze performance using Sharpe ratio, win rate, and drawdown rather than “gut feeling.” |
| Clear Rules | Set predefined entry/exit rules and stick to them strictly. |
Final Thought
Psychological biases don’t just affect discretionary traders—they influence how automated strategies are designed, optimized, and managed. The key is to use data-driven decisions and avoid letting emotions creep into strategy development.
What are some of the more popular indicators to use when creating an automated trading strategy?
What are some of the more popular indicators to use when creating an automated trading strategy?
The platform provides a comprehensive suite of technical indicators as drag-and-drop blocks. These tools allow traders to build intuitive, multi-factor strategies by combining different categories of market analysis.
1. Momentum Indicators
Momentum indicators are designed to measure the speed and change of price movements. They are widely used by retail traders to identify overextended market conditions.
- Available Indicators: RSI, MACD, Stochastic Oscillator.
- Why Use Them: These indicators provide intuitive signals for overbought or oversold conditions.
- Example Use Case:
- Buy Signal: Trigger when RSI < 30 (Oversold).
- Sell Signal: Trigger when the MACD line crosses below the signal line.
2. Trend Indicators
Trend-following strategies are a cornerstone of systematic trading. These indicators help users determine the current market direction and trend strength.
- Available Indicators: Moving Averages (SMA/EMA), ADX, Ichimoku Cloud.
- Customization: Users can define trend durations as short, medium, or long to fit their specific trading style.
- Example Use Case:
- Buy Signal: Price is above the 50 EMA and ADX > 25, indicating a strong upward trend.
- Sell Signal: Price crosses below the Ichimoku Cloud.
3. Reversal & Volatility Indicators
These indicators add precision by spotting price extremes and measuring market fluctuations to manage risk dynamically.
3.1 Reversal Indicators
Used to identify potential turning points in the market.
- Tools: Fibonacci Retracement, Candlestick Patterns, Bollinger Bands.
- Example: Buy when price touches the lower Bollinger Band and RSI confirms an oversold state.
3.2 Volatility Indicators
Essential for setting dynamic risk management parameters.
- Tools: ATR (Average True Range), Bollinger Bands.
- Example: Exit trades automatically when ATR spikes above a user-defined threshold.
4. Volume-Based Indicators
Volume indicators confirm the strength of price movements by analyzing trading activity.
- Available Indicators: VWAP, On-Balance Volume (OBV).
- Why Use Them: VWAP is critical for intraday accuracy, while OBV confirms trend strength.
- Example Use Case:
- Entry: Buy when price crosses above VWAP with a rising OBV.
- Exit: Close the position when price falls below VWAP.
5. Suggested Integration Features
To maximize the effectiveness of these indicators, the platform supports several advanced features:
| Feature | Description |
|---|---|
| Visual Blocks | Draggable blocks with customizable parameters like period, width, and type. |
| Combination Conditions | Allow multi-factor strategies by combining indicators (e.g., RSI + MACD). |
| Backtesting | Assess historical performance before deploying your indicator-based strategy. |
| Dynamic Risk | Use ATR or Fibonacci levels for automated stop-loss and take-profit adjustments. |
Would you like me to help you create a custom “Visual Block” strategy that combines the 50 EMA Trend filter with an RSI Momentum entry?
What is a Strategy Number?
What is a Strategy Number?
A Strategy Number is a unique identifier assigned to every strategy created on the platform. It acts as a digital fingerprint, helping both users and the support team accurately identify, track, and troubleshoot a specific strategy configuration.
Should You Hold Positions Overnight or Close at the End of the Day?
Should You Hold Positions Overnight or Close at the End of the Day?
When building automated strategies, one of the most important decisions traders face is whether to flatten positions at the close or carry risk overnight. The right choice depends on the type of strategy, market conditions, and your personal risk tolerance.
Why This Matters
- Risk Management: Overnight exposure introduces risks from earnings, geopolitical events, or macroeconomic surprises that can cause price gaps at the open.
- Return Potential: Some strategies capture most of their edge overnight, while others lose their statistical advantage outside of intraday trading.
- Capital Efficiency: Closing daily frees up capital but may reduce returns for strategies designed to span multiple sessions.
Factors to Consider
1. Strategy Type
- Mean Reversion: Often short-term, designed to profit from intraday dislocations.
- Momentum: Can be intraday or multi-day, depending on the signal’s duration.
2. Time Horizon of the Signal
- Intraday signals: The edge usually fades after the session ends.
- Multi-day signals: A continuation edge requires holding across sessions.
3. Risk Tolerance
- Conservative: Traders may prefer closing daily to avoid overnight uncertainty.
- Aggressive: Trend-focused traders may accept overnight risk for larger potential gains.
4. Market Conditions
- High volatility or event-heavy periods (earnings season, Fed announcements) increase overnight risk.
- Quiet markets may favor holding positions longer.
[Image of a candlestick chart showing a large overnight price gap between market close and open]
When should I have my strategy start trading?
When should I have my strategy start trading?
The 9:30 AM Opening Bell: Timing Your Execution
The U.S. equity markets officially open at 9:30 AM ET, but the first 15 minutes of trading are very different from the rest of the day. For systematic traders, deciding when to allow a strategy to begin trading can impact both risk and performance.
Why the Open Is Unique
The market open is a period of intense activity driven by the accumulation of overnight data.
- Volatility Spike: Overnight news, earnings releases, and order imbalances often create sharp moves at 9:30.
- Wide Spreads: Liquidity is thinner and bid/ask spreads are widest right at the open, which can lead to higher slippage.
- Execution Risk: Limit and stop orders can get filled at less favorable prices compared to later in the session.
- Opportunity: These same dynamics also present unique opportunities, especially for traders who design strategies to capture opening momentum.
Waiting for Volatility to Normalize
By 9:30–9:45, order books usually deepen, spreads tighten, and price action becomes more stable. Many traders find that waiting even 10–15 minutes reduces “false signals” and improves overall execution quality.
When You Need the Strategy Number?
When You Need the Strategy Number?
Identifying your Strategy Number is essential in the following scenarios:
- Support Requests: When connecting with the support team for help or issue resolution.
- Live Monitoring: To identify exactly which strategy is currently running in a live environment.
- Organization: To locate a specific saved or previously created strategy among many.
- Analysis: During debugging, incident analysis, or performance reviews.
Why it matters: Sharing the Strategy Number ensures the support team can instantly locate the correct strategy, significantly speeding up resolution times.
How to Locate the Strategy Number?
How to Locate the Strategy Number?
The Strategy Number is accessible in two primary locations, depending on whether you are testing or executing live.
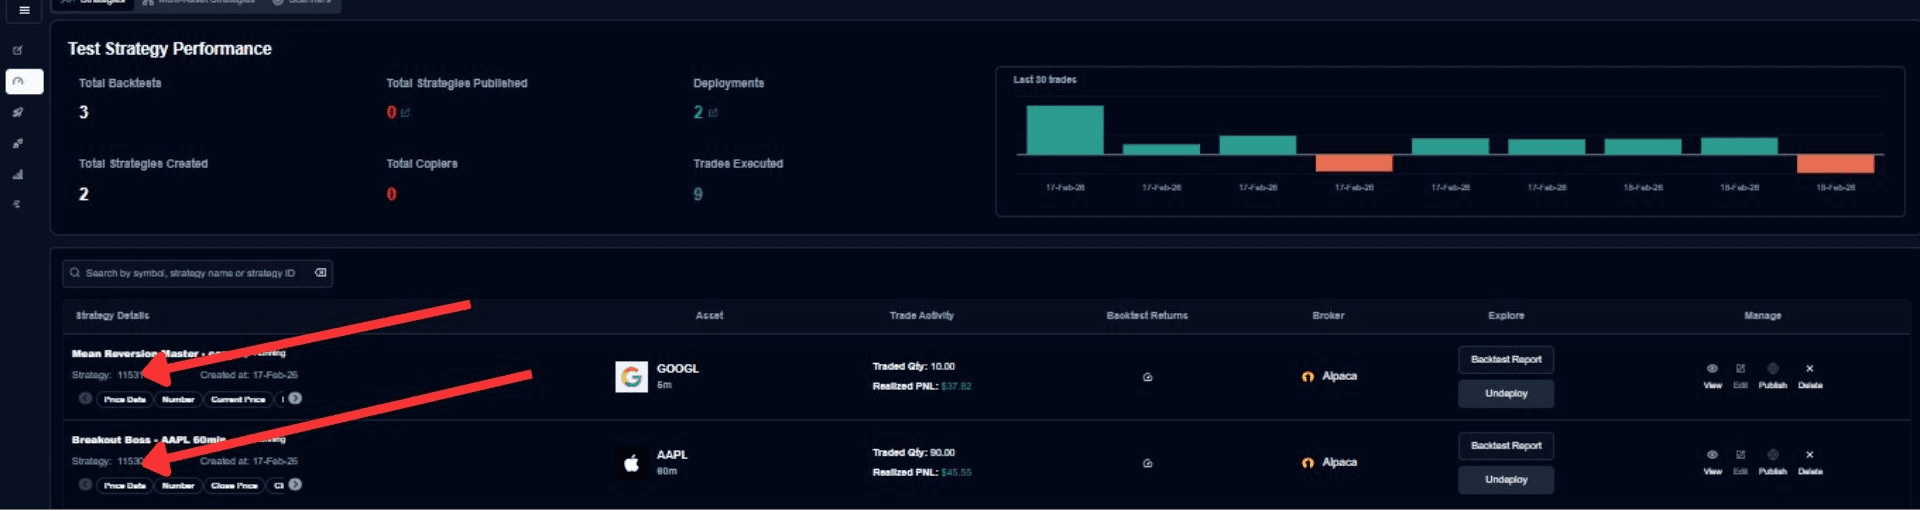
Test Page (Backtest Screen)
When you are analyzing historical performance, the number is permanently displayed in the strategy overview.
- Navigate to the Test Page.
- Refer to the Strategy Details section.
- The Strategy Number is displayed alongside the strategy name and parameters.
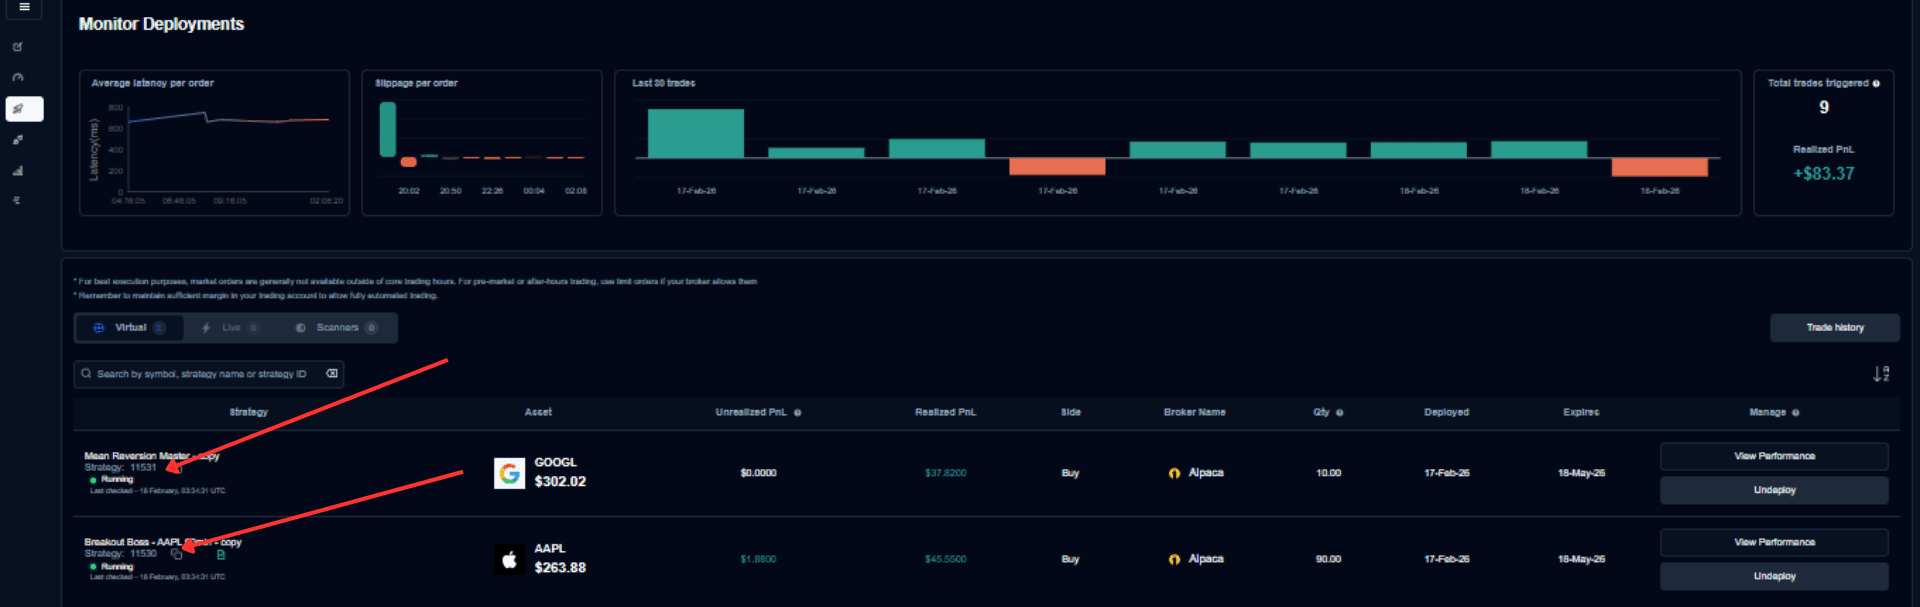
Deploy Page (For Live Strategies)
For strategies that have moved beyond testing into live or paper trading:
- Navigate to the Deploy Page.
- Locate your active or paused strategy.
- The Strategy Number will be visible within the Deployed Strategy Details card.
What are some of the things to think about and “best practices” I should follow to adapt to changing market conditions?
What are some of the things to think about and “best practices” I should follow to adapt to changing market conditions?
Financial markets are dynamic, and no strategy works indefinitely. Even the most well-crafted trading strategies can falter when market conditions change. Adapting your approach ensures long-term success. Here’s how to stay ahead of the curve:
1. Understand Market Regimes
Markets are not static; they cycle through different states that require specific approaches.
- Types of Market Conditions: Markets can trend, range, or experience high/low volatility. A strategy optimized for a trending market may perform poorly in a ranging market.
- Detecting Regime Shifts: Use tools like the Average True Range (ATR), Bollinger Bands, or moving average crossovers to identify changes in volatility or trends.
2. Monitor Strategy Performance
Regular maintenance is required to ensure your logic still matches the market reality.
- Review Metrics: Regularly review performance metrics like win rate, profit factor, Sharpe ratio, and drawdown.
- Identify Decline: Watch for declining performance over time, which could indicate that the market environment no longer suits your strategy.
3. Incorporate Robustness Testing
Testing should go beyond a single historical period.
- Diverse Environments: Test your strategies in different market environments during backtesting, such as bull markets, bear markets, and periods of high and low volatility.
- Stress Testing: Simulate adverse conditions to ensure your strategy can survive extreme market moves.
4. Use Adaptive Indicators
Replace static parameters with adaptive ones to allow the strategy to “breathe” with the market.
- Dynamic Stops: Use an ATR-based trailing stop instead of a fixed point stop.
- Volatility Adjustments: Adjust moving average lengths based on current market volatility.
- Modern Tools: Use indicators like the Kaufman Adaptive Moving Average (KAMA), which are natively designed to adapt to changing conditions.
5. Strategic Diversification & Automation
Don’t put all your capital into a single logic type.
- Diversify: Avoid over-reliance on a single strategy. A portfolio of strategies designed for different conditions (e.g., pairing trend-following with mean-reversion) can help balance returns.
- Set Alerts: Automate alerts for when key performance metrics fall below thresholds, such as prolonged drawdowns or reduced win rates.
- Automate Adaptation: Use conditional logic in your automation platform (like Level2) to switch strategies or adjust parameters automatically.
- Example: When ATR increases beyond a threshold, switch from mean-reversion to breakout logic.
6. Sentiment & External Factors
Technical analysis is often influenced by broader fundamental shifts.
- Monitor Fundamentals: Track earnings reports, central bank announcements, or geopolitical events that shift market dynamics.
- Sentiment Pairing: Pair sentiment indicators like the VIX with your technical indicators to anticipate potential shifts.
7. Regular Reevaluation & The Power of Pausing
- Reevaluate: Conduct monthly or quarterly reviews to identify if strategies are still aligned with current conditions. Avoid over-optimization (curve fitting) and aim for general strategies that work across various conditions.
- Know When to Pause: Sometimes the best action is to pause trading altogether during uncertain or extreme conditions, such as black swan events. Preserving capital is as important as making profits.
Conclusion
Adapting to changing markets requires vigilance, flexibility, and continuous improvement. By incorporating these practices, you ensure your strategies remain relevant and effective over time.
How to Copy a Strategy?
How to Copy a Strategy?
Leveraging Public Success: Copying Trending Strategies
Using the Top Trending section is a smart way to learn from strategies that are already performing well in live markets. Instead of building everything from scratch, you can study what’s working for others and apply similar logic to your own trading.
How to Copy and Use a Public Strategy
Discovery:
Go to the main dashboard and browse the list of top-trending strategies.
Performance Check:
Review the strategy’s results and risk levels to ensure they align with your goals.
Review the Logic:
Click the View option to see how the strategy is built.
Copy the Strategy:
Use the Copy button to transfer the logic blocks directly to your own Canvas.
Why Visual Transparency Matters
Seeing the strategy in a clear visual format on the Canvas helps you avoid mistakes. It prevents “black box” problems where you don’t fully understand how the strategy works.
Before copying, review the logic flow and confirm everything makes sense. This reduces errors and gives you more confidence before using real capital.
Internal Efficiency: Reusing Your Own Strategies
You can improve efficiency by reusing your own proven strategies across different symbols and timeframes. Instead of rebuilding from scratch, simply copy your existing logic and adjust it for a new market.
Method A (From the Canvas)
While building or editing a strategy, use the Copy Strategy option to import logic from your personal library.
Method B (From a Backtest Report)
While reviewing past results, click Copy Strategy directly from the backtest report to quickly create a new version for further testing.
Key Components for Replication
- Personal Strategy Library – Where all your saved strategies are stored.
- Copy Strategy Button – Available on both the Canvas and inside backtest reports.
These tools make it easy to quickly move from an existing strategy to a new test version.
Adaptation and Optimization: The “Tweak and Test” Process
When you copy a strategy, treat it as a starting point — not a finished product. Each symbol behaves differently based on volatility and liquidity.
To get the best results, adjust and test the strategy to fit the specific market you are targeting.
Small changes and continuous testing help improve performance and get better results from each instrument.
How do I go about reducing false signals?
How do I go about reducing false signals?
Reducing the risk of “False Signals.”
Reducing the risk of false signals in automated trading strategies requires a combination of techniques to improve the reliability of technical indicators and patterns. Use the following approaches to enhance the quality of your execution.
1. Indicator Confluence
Use multiple technical indicators or patterns to confirm signals before executing trades.
- Trend + Momentum: Combine trend-following indicators (e.g., Moving Averages) with momentum indicators (e.g., RSI or MACD).
- Alignment: Require alignment across different types, such as an RSI oversold signal paired with a bullish candlestick pattern.
- Volume Confirmation: If trading a breakout, confirm that the price break of a key level is supported by an increase in trading volume.
[Image of a trading chart showing confluence between a Moving Average crossover and an RSI breakout]
2. Timeframe & Filter Optimization
Filtering out short-term noise is essential for maintaining a high win rate.
- Longer Timeframes: These often yield more reliable signals as they filter out short-term fluctuations.
- Multi-Timeframe Analysis: Check trends on a higher timeframe (e.g., Daily chart) and execute trades on a lower timeframe (e.g., Hourly chart).
- Volatility Filters: Avoid signals when the Average True Range (ATR) is unusually low, indicating stagnant market activity.
- Event Filtering: Avoid trading during major news events or high-volatility periods unless your strategy specifically accounts for them.
3. Statistical & Price Validation
Ensure your logic is grounded in both historical data and current price action.
3.1 Price Action Integration
Combine indicators with price action analysis, such as:
- Support and resistance levels.
- Candlestick patterns or chart formations like triangles and head-and-shoulders.
- Confirmation Criteria: Require an indicator to exceed a threshold for multiple periods before acting, or wait for additional candles to confirm pattern completion.
3.2 Robustness Testing
- Validation: Backtest strategies thoroughly using metrics like Sharpe ratio, profit factor, and maximum drawdown.
- Avoid Overfitting: Ensure the strategy isn’t overly tuned to historical data, which can lead to poor performance in live markets.
- Walk-Forward Optimization: Test strategies across varying market conditions to ensure longevity (Coming soon to Level2).
4. Adaptive Risk Management
Dynamic strategies adjust to the market rather than fighting it.
| Technique | Implementation |
|---|---|
| Market Regimes | Use ADX or Bollinger Band width to detect if the market is trending or ranging. |
| Dynamic Logic | Use trend-following strategies in trending markets and mean-reversion in consolidating markets. |
| Tight Controls | Use tight stop-losses and trailing stops to mitigate the financial impact of a false signal. |
| Position Sizing | Incorporate rules to minimize exposure on potentially “noisy” or lower-probability trades. |
[Image of Bollinger Band width indicator showing the transition from a low-volatility squeeze to a high-volatility breakout]
Key Takeaway
Confirmation is the enemy of drawdown. By requiring multiple points of data to agree—such as price action, volume, and momentum—you significantly reduce the likelihood of entering on a “false” move.
Why do I need to connect a broker before building a strategy?
Why do I need to connect a broker before building a strategy?
Level2 uses broker market data for:
- Charts
- Indicators
- Backtesting
- Live trading
Even if you are not trading live, the system still needs a connection to the broker.
Can one strategy work for multiple stocks?
Can one strategy work for multiple stocks?
No. Each strategy is linked to one ticker.
If you want the same logic for multiple stocks, you must create separate strategies.
Why is the backtest timeframe limited?
Why is the backtest timeframe limited?
Long backtests require heavy computation and slow the platform. To keep the experience fast, Level2 limits:
- Number of bars
- Timeframe size
Future versions may allow longer backtests.
What is the difference between Buy and Smart Buy?
What is the difference between Buy and Smart Buy?
- Buy Uses fixed take-profit and stop-loss
- Smart Buy Uses logic rules to exit the trade
Smart Buy often gives better results because exits are dynamic.
How do I contact support?
How do I contact support?
Email us at support@trylevel2.com