Broker Dashboard
This dashboard provides operational, performance, infrastructure, and user-level insights for deployed trading strategies within a selected date range.
-
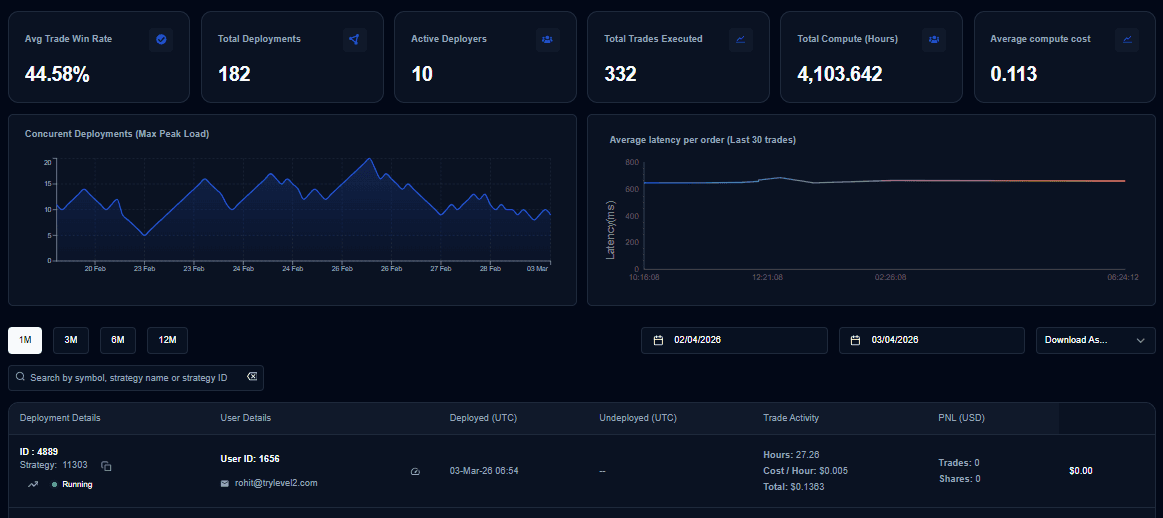
Avg Trade Win Rate: Represents the percentage of executed trades that closed profitably.
- Calculation: (Winning Trades ÷ Total Closed Trades) × 100.
-
Total Deployments: Total number of strategy or bot deployments created on the platform.
- Scope: Includes both currently active and previously stopped deployments.
-
Active Deployers: Number of unique users currently running at least one live deployment.
- Significance: Reflects real-time active participation on the platform.
-
Total Trades Executed: Cumulative count of all trades executed across all deployments.
- Scope: Includes both buy and sell orders processed by the system.
-
Total Compute (Hours): Total infrastructure runtime consumed by all deployments in hours.
- Purpose: Represents aggregated processing time used for strategy execution.
-
Average Compute Cost: Average infrastructure cost per compute hour.
- Calculation: Calculated by dividing total compute spend by total compute hours.
-
Concurrent Deployments (Max Peak Load): Displays the number of concurrent deployments over time.
- Load Monitoring: The peak value indicates the highest system load reached during the selected period.
-
Average Latency per Order (Last 30 Trades): Shows the average execution time (in milliseconds) for the most recent 30 trades.
-
Usage: Used to monitor order processing speed and system performance efficiency.
Key Takeaway
Monitoring Average Latency alongside Win Rate helps identify if execution delays are impacting strategy profitability. High latency during peak concurrent deployments may necessitate infrastructure scaling.