Marketplace
The Marketplace dashboard provides real-time data on the overall activity and dominant trends within the trading ecosystem.
1. Marketplace Analytics
1.1 Recent Trades
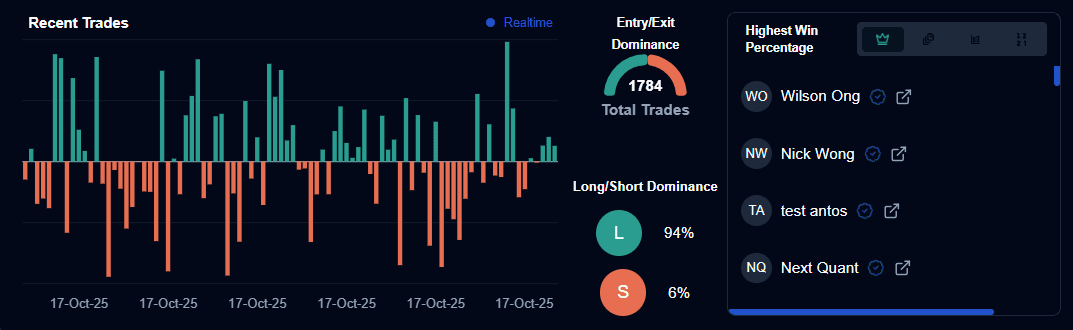
This chart visualizes the outcome of the most recent trades executed across all platform strategies.
- Positive Bars (Green): Indicate profitable trades.
- Negative Bars (Orange): Indicate losing trades.
- Real-time Monitoring: The horizontal axis tracks execution dates to help users identify current market sentiment.
1.2 Market Dominance Metrics
- Total Trades: The cumulative number of trades executed by all strategies currently being monitored (e.g., 1,782).
- Entry/Exit Dominance: A gauge showing the ratio of successful entries versus exits.
- Long/Short Dominance: Displays the percentage of strategies favoring Long (L) positions (e.g., 94%) versus Short (S) positions (e.g., 6%).
2. Global Leaderboards
The leaderboard highlights top-performing traders and strategies based on four key competitive metrics:
- Highest Win Percentage: Displays traders with the most consistent success rate (e.g., 100.0%).
- Highest Copiers Count: Ranks traders by social proof and community trust.
- Highest Trades Triggered: Identifies the most active strategies currently executing in the market.
- Highest Strategies Created: Showcases the most prolific strategy developers on the platform.
3. Advanced Discovery & Filters
Users can use granular filters to find strategies that match their specific risk tolerance and trading style.
3.1 Performance & Risk Filters
- Win Percentage: Filter for strategies that meet a minimum historical success rate.
- Copiers: Search for strategies based on their popularity and adoption.
- Sharpe Ratio: Filter strategies by their risk-adjusted returns.
- Drawdown: Search for strategies by their risk profile; smaller drops mean lower risk, while larger drops mean higher risk.
3.2 Technical & Asset Filters
- Symbol Search: Search for strategies applied to a specific asset (e.g., META).
- Timeframe: Filter by chart intervals (e.g., 15m, 1h).
- Indicator Category: Select strategies based on technical type (e.g., Volume, Momentum, Volatility, Trend).
- Action: Filter by trade direction (e.g., Buy Long).
3.3 Risk Management Ranges
- Stop Loss Range: Define the acceptable risk per trade (e.g., 0.5%-10%).
- Take Profit Range: Define the target reward levels (e.g., 0.5%-10%).
4. Systematic Trading Guides
The marketplace categorizes strategies into “Systematic Guides” to help traders match their logic to the current market environment:
| Guide Type | Description |
|---|---|
| Bull Market | Optimized for upward-trending environments. |
| Bear Market | Tailored for declining markets and short-selling setups. |
| Neutral Market | Designed for sideways consolidation or range-bound trading. |
| Multi-Market | Versatile strategies that attempt to adapt to various conditions. |
User Actions
From the Marketplace, you can perform the following actions:
- Check Profiles: Click on a trader to see their Avg Win, Total Trades, and Total Strategies.
- Check Strategy: View the specific Logic Blocks and Add-ons used to create the logic.
- Copy: Directly duplicate a high-performing strategy to your own library for deployment.
Last updated on