Bollinger Band Volatility Breakout
Strategy Overview
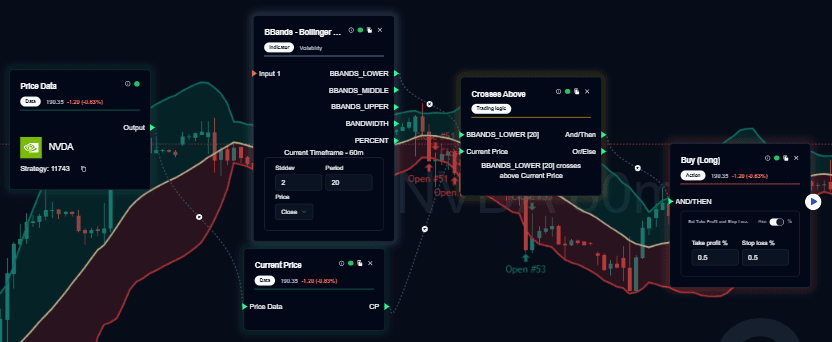
The Bollinger Band Volatility Breakout is a momentum-driven system designed to capture the early stages of a powerful price expansion. It operates on the principle that when price breaks out of its standard volatility range, it often indicates the start of a new, sustained trend.
The strategy enters a Long (Buy) position when price action violates the upper boundary of the Bollinger Bands, signaling that buyers have overcome the previous resistance.
Indicators Used
| Component | Function |
|---|---|
| Price Data | Uses the Closing Price to ensure the breakout is sustained and not just a temporary “wick” or spike. |
| Bollinger Bands | A dynamic indicator that adjusts to market volatility. It consists of a Middle Band (Moving Average) and two outer bands representing standard deviations of price. |
| Current Price | The real-time value used to monitor for an immediate breach of the upper boundary. |
| Crosses Above (Logic) | The mathematical trigger that validates a volatility expansion. It requires the price to move from inside the bands to outside the upper band. |
Trading Logic
Buy Condition (Long Entry)
A trade is initiated when the following structural conditions are met:
- Crossover Validation: The current price moves from below the Upper Bollinger Band to above it.
- Momentum Confirmation: The crossover must be a clean break, indicating that the market is entering a high-volatility phase.
- Volatility Expansion: As the price pushes the upper band, the bands typically “flare” or expand, confirming that the move is backed by volume and momentum.
Strategy Behavior
- Momentum Capture: Focuses exclusively on “active” markets where price is making significant moves.
- Choppiness Filter: By requiring a break of the upper band, the strategy naturally stays out of trades during quiet, sideways consolidation.
- Early Trend Identification: Often catches the “first leg” of a major trend as volatility begins to spike.
Market Applicability
✅ Best Used In
- Volatile Markets: Assets with a history of strong, trending moves.
- Breakout Sessions: High-volume periods such as the London or New York market opens.
- Intraday Timeframes: Most effective on 5-minute, 15-minute, and 30-minute charts.
- Liquid Assets: Highly recommended for Major Indices, Large-Cap Stocks, and Crypto.
❌ Avoid Using In
- Range-Bound Markets: When the price is bouncing between the upper and lower bands without breaking through, leading to “whipsaw” losses.
- Low-Volume Lulls: During lunch hours or after-market sessions where breakouts lack follow-through.
- The “Squeeze” Phase: While a Bollinger Band Squeeze (narrow bands) often precedes a breakout, traders should avoid entering inside the squeeze until the price actually crosses above the band.
Note: This documentation provides only analytical structural recognition and is not a direct financial recommendation.
Last updated on