Realtime Backtest
The Realtime Backtest provides a high-speed performance check for your strategy by simulating its behavior on recent historical data. It is the primary tool for rapid prototyping, allowing you to validate logic accuracy and execution flow before moving to a long-term simulation.
Note: Realtime backtests are optimized for speed and immediate validation. For exhaustive analysis and long-term historical validation, users should utilize the Comprehensive Backtest.
How Realtime Backtest Works
The system is engineered to balance technical precision with near-instant results:
- Data Depth: Uses the last 5,000 historical data points (candles) of your selected timeframe to compute performance.
- Execution Flow: Simulates a realistic trading environment to ensure your entry and exit logic triggers exactly as expected.
- Speed: Delivers results in seconds, making it ideal for checking how minor tweaks to your indicator periods or logic blocks affect your outcome.
Integration & Access
Realtime Backtest is built to be accessible whether you are building visually or programmatically:
- Visual Strategy Builder: If your broker uses the visual builder, Realtime Backtest is supported by default. No additional configuration is required; the results update as you build.
- API Access: Developers can integrate these simulations into their own workflows via the Realtime Backtest API.
Dashboard Metrics Explained
Once a backtest completes, the dashboard provides three critical “health signals” for your strategy:
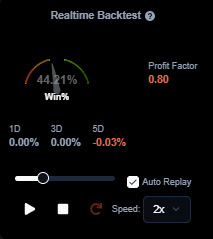
1. Win %
This represents the Win Rate. It is the percentage of total trades that closed with a net profit.
Formula: (Profitable Trades / Total Trades) * 100
2. Profit Factor
This is the most vital metric for assessing the sustainability of a strategy. It is the ratio of gross profits to gross losses.
- > 1.0: The strategy is historically profitable.
- < 1.0: The strategy is losing money.
- Ideal: Most professional traders look for a Profit Factor above 1.5.
3. 1D / 3D / 5D Performance
These metrics break down the strategy’s performance over the most recent 1-day, 3-day, and 5-day windows. This helps you identify if the strategy is consistent or if its performance was skewed by a single lucky day of market volatility.
Technical Constraints
- Data Samples: Because this tool uses a fixed 5,000-point sample, results on a 1-minute chart will cover a shorter historical duration than results on a 15-minute chart.
- Validation Focus: Always use this tool to confirm your logic is working as intended (e.g., checking if it’s buying where it should) before relying on the profit metrics for live deployment.