Chart Patterns
- Bullish Gartley Chart Pattern:
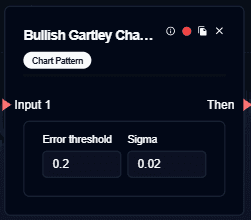
A harmonic XABCD structure where price forms a “W”-like shape. Defined by precise Fibonacci retracements and extensions, completing near a measured convergence zone.
- Bearish Gartley Chart Pattern:
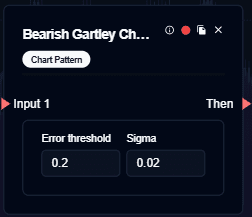
A harmonic XABCD structure resembling an “M” shape. Pattern validity is determined by strict Fibonacci relationships between each leg.
- Bearish Butterfly Chart Pattern:

A harmonic pattern where the final leg extends beyond the initial price origin. Characterized by deep Fibonacci projections at pattern completion.
- Bullish Butterfly Chart Pattern:

A mirror version of the Butterfly structure with extended completion. Uses specific Fibonacci retracements and extensions to define its geometry.
- Bullish Bat Chart Pattern:
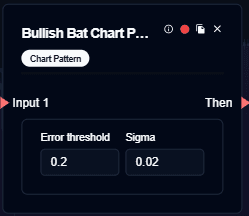
A harmonic pattern with a relatively shallow retracement at point B. Completion occurs at a deeper Fibonacci level without exceeding the origin point.
- Bearish Bat Chart Pattern:

The bearish counterpart of the Bat pattern with identical ratio rules. Distinguished from Gartley by its retracement depth and completion level.
- Bullish Crab Chart Pattern:
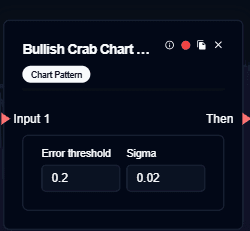
A harmonic structure known for its extreme Fibonacci extension at completion. The final point forms significantly beyond the initial impulse range.
- Bearish Crab Chart Pattern:
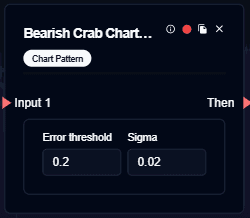
A bearish variation of the Crab pattern with identical structural rules. Emphasizes extended Fibonacci projections rather than symmetry.
- Bullish Deep Crab Chart Pattern:

A stricter version of the Crab pattern with a very deep retracement at point B. Completion is defined by large Fibonacci extensions.
- Bearish Deep Crab Chart Pattern:
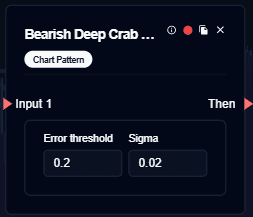
The bearish counterpart of the Deep Crab structure. Characterized by deep retracement and extended completion zones.
- Bullish Shark Chart Pattern:
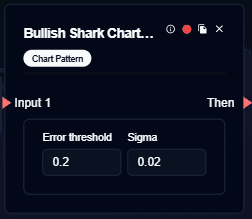
A five-leg harmonic structure (O-X-A-B-C) that forms earlier than traditional patterns. Uses aggressive and non-standard Fibonacci measurements.
- Bearish Shark Chart Pattern:
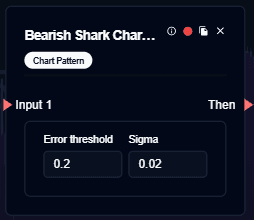
A bearish version of the Shark pattern with the same structural logic. Relies on extended Fibonacci relationships rather than symmetry.
- Bullish Cypher Chart Pattern:

A modern harmonic pattern with asymmetric leg relationships. Pattern identification depends on strict Fibonacci dependencies between XC and AB.
- Bearish Cypher Chart Pattern:
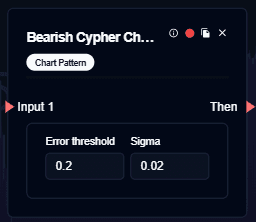
The bearish counterpart of the Cypher structure. Defined by precise ratio alignment rather than visual balance.
- Bull Flag Chart Pattern:
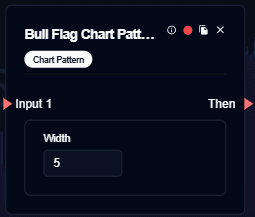
A continuation pattern formed by a strong upward move followed by consolidation. The consolidation typically appears as a downward-sloping channel.
- Bear Flag Chart Pattern:
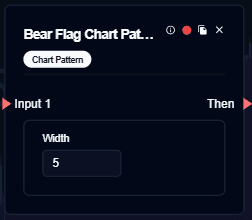
A continuation structure following a sharp downward move. Characterized by a brief upward or sideways consolidation.
- Bull Pennant Chart Pattern:
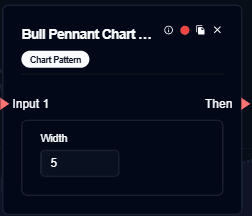
A continuation pattern featuring a sharp upward move followed by a small symmetrical consolidation. Represents temporary price compression after expansion.
- Bear Pennant Chart Pattern:
The bearish counterpart of the Bull Pennant. Forms after a strong decline and consolidates within converging trendlines.
- Head and Shoulders Chart Pattern:
A reversal pattern composed of three peaks, with the middle peak being the highest. Represents a gradual transition in market structure.
- Inverse Head and Shoulders Chart Pattern:
A mirrored version of the Head and Shoulders pattern. Formed by three troughs, with the central trough being the deepest.