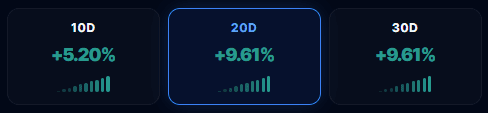
This section provides a complete overview of how your strategy performed during backtesting using historical data.
Note: Backtest results are based on past data and do not guarantee future performance. Always validate your strategy logic and risk management before deploying live. If the results meet your prop firm criteria, you can connect your API to paper trade or go live.
Evaluation Period
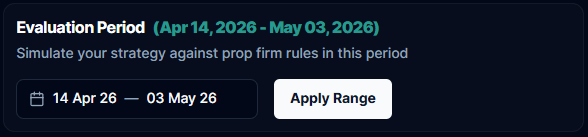
Defines the time range used to simulate your strategy.
- Date Range: Allows you to test performance within specific dates.
- Alignment: Helps align results with prop firm evaluation rules.
- Apply Range: Updates the results based on the selected period.
Key Metrics
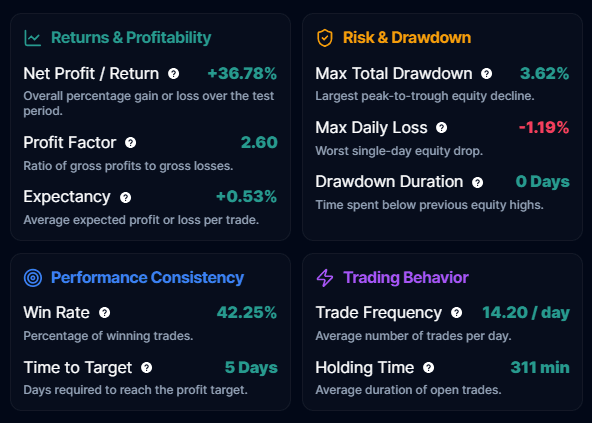
Returns & Profitability
- Net Profit / Return: Overall percentage gain or loss during the test period. Indicates whether the strategy is profitable or not.
- Profit Factor: Ratio of total profits to total losses. A value > 1 indicates profitability, while < 1 indicates losses.
- Expectancy: Average profit or loss per trade. Helps estimate long-term performance per trade.
Risk & Drawdown
- Max Total Drawdown: Largest drop in equity from peak to lowest point. A key indicator of overall risk.
- Max Daily Loss: Biggest loss recorded in a single day. Important for prop firm rule compliance.
- Drawdown Duration: Time taken to recover from a drawdown. Shows how long the strategy stays below peak equity.
Performance Consistency
- Win Rate: Percentage of trades that were profitable. Indicates consistency, not profitability alone.
- Time to Target: Time taken to reach a defined profit goal. Useful for evaluating strategy efficiency.
Trading Behavior
- Trade Frequency: Average number of trades executed per day. Helps identify if the strategy is high-frequency or low-frequency.
- Holding Time: Average duration trades are kept open. Indicates whether the strategy is scalping, intraday, or swing-based.
Strategy Summary Indicators
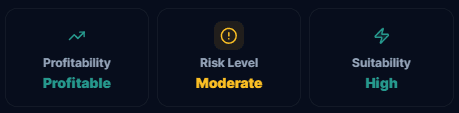
| Indicator | Description |
|---|---|
| Profitability | Shows whether the strategy is overall profitable or not. |
| Risk Level | Indicates the level of risk involved (e.g., low, moderate, high). |
| Suitability | Suggests how suitable the strategy is for deployment or prop firm usage. |
Equity Graph
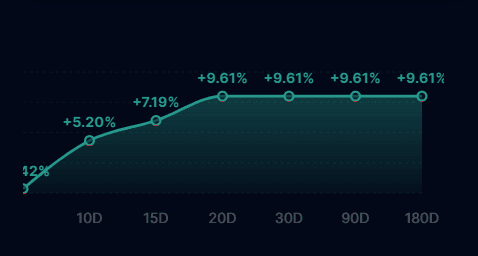
The Equity Graph provides a visual representation of strategy performance over time:
- Shows growth or decline of equity.
- Helps identify trends, volatility, and drawdowns.
- Useful for quickly assessing consistency and risk.
Report Download
You have the option to download the full backtest report. This can be used for deeper analysis, sharing with stakeholders, or personal record-keeping.
Last updated on