Top Strategies
The strategy card provides a high-level summary of how a specific trading logic operates, its target market, and its historical or live performance metrics.
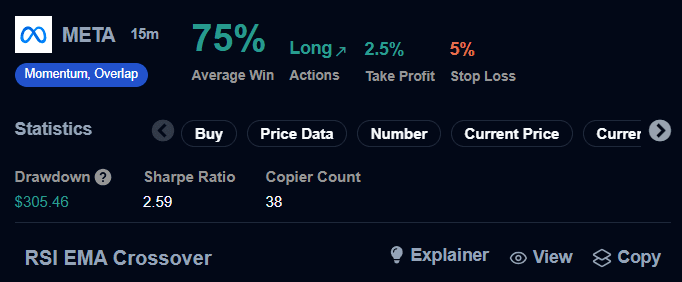
1. Strategy Header: Asset & Execution
The top section of the strategy card defines the target market and the core trade parameters.
- Symbol Name: The ticker symbol (e.g., META) indicating the specific asset the strategy is monitoring.
- Timeframe: The chart interval (e.g., 15m) used by the strategy to analyze price data and execute signals.
- Strategy Categories: Labels (e.g., Momentum, Overlap) that classify the types of indicators used in the logic.
- Average Win: The percentage of trades that resulted in a profit (e.g., 75%) based on historical or live performance data.
- Actions: The execution type (e.g., Long) indicates that the strategy is designed to buy and profit from upward price movements.
2. Strategy Add-ons: Risk Management
These optional controls manage the financial boundaries of each active trade to ensure disciplined execution.
- Take Profit: The target price level (e.g., 2.5%) at which the strategy will automatically close a position to lock in gains.
- Stop Loss: The risk threshold (e.g., 5%) where the strategy will exit a position to prevent further losses.
3. Statistics & Risk Metrics
This section provides deep insights into the strategy’s risk-adjusted performance and community adoption.
Risk and Performance
- Drawdown: Measures the peak-to-trough decline of the strategy (e.g., $305.46). It quantifies the maximum loss experienced from a previous high point; smaller drawdowns indicate lower risk, while larger ones indicate higher risk.
- Sharpe Ratio: A statistical measure (e.g., 2.59) used to understand the return of an investment compared to its risk. A higher Sharpe ratio generally indicates better risk-adjusted performance.
- Copier Count: The total number of users (e.g., 38) who have copied this specific strategy to use in their own accounts.
Strategy Composition
The Statistics row highlights the specific Logic Blocks and Data Inputs used to build the strategy logic:
- Buy/Action Blocks: Defining the trade direction.
- Price Data: Utilizing OHLCV (Open, High, Low, Close, Volume) inputs for calculations.
- Number Blocks: Used for logic comparisons and setting specific thresholds.
- Current Price: Monitoring real-time market value for precise execution.
4. Strategy Identity: RSI EMA Crossover
The footer identifies the specific name of the logic and provides tools for further interaction:
- Explainer: Provides a plain-English breakdown of the logic behind the strategy.
- View: Opens the strategy to display detailed charts and historical trade logs.
- Copy: Enables you to duplicate the strategy to your own library for deployment or further customization.
Last updated on