Golden Cross Trend Follower
Strategy Overview
The Golden Cross Trend Follower is a classic momentum-based strategy that identifies long-term structural shifts in market direction. By utilizing two Simple Moving Averages (SMAs), the strategy aims to capture major uptrends while filtering out short-term market “noise.”
The philosophy is simple: Buy strength and exit on weakness. It ensures you are positioned on the right side of the market during sustained moves and provides a clear, objective signal for when a trend has likely concluded.
Indicators Used
| Indicator | Function |
|---|---|
| 50-Period SMA | Acts as the “Fast” average. It reflects the medium-term momentum and reacts to recent price shifts. |
| 200-Period SMA | Acts as the “Slow” average. It serves as the long-term trend “anchor” and is a major psychological level for institutional traders. |
How the Strategy Trades
Buy (Long Entry)
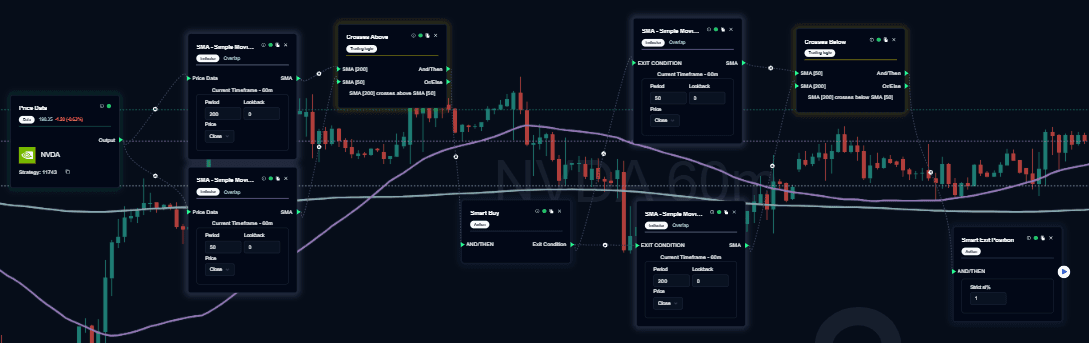
A trade is triggered when a Golden Cross occurs:
- The Signal: The 50-period SMA crosses above the 200-period SMA.
- Market Context: This shift suggests that short-term momentum is now stronger than the long-term average, signaling the birth of a potential bull market.
- Action: A Long (Buy) order is placed immediately upon the confirmed crossover of the moving averages.
Sell (Exit)
The position is closed when a Death Cross occurs:
- The Signal: The 50-period SMA crosses below the 200-period SMA.
- Market Context: This suggests the uptrend has lost its structural support, and selling pressure is beginning to dominate the long-term trend.
- Action: The strategy exits the active position to lock in gains or prevent further capital erosion during a trend reversal.
Strategy Behavior
- Precision Entry: Only acts on confirmed mathematical crossovers to avoid “guessing” the bottom.
- Single Exposure: To manage risk, the strategy holds only one position at a time.
- Passive Management: Requires no manual intervention; the system continuously monitors the relationship between the two averages and reacts only to confirmed signals.
When to Use This Strategy
✅ Best Used In
- Trending Markets: Highly effective in markets that make clear directional moves over weeks or months.
- Liquid Assets: Best performed on Blue-chip stocks, Major Indices (e.g., S&P 500, Nasdaq), and large-cap Cryptocurrencies.
- Long-Term Timeframes: While it can be used for intraday trading, it is most famous for Daily and Weekly chart analysis.
❌ Avoid Using In
- Range-Bound Markets: In “choppy” or sideways markets, the averages may cross back and forth (whipsaw), leading to multiple small losses.
- Low Volatility: When the price stays flat, the SMAs converge, making signals unreliable.
- Sudden News Shocks: Moving averages are “lagging” indicators; they may not react fast enough to a sudden, news-driven crash.
Note: This documentation provides only analytical structural recognition and is not a direct financial recommendation.
Last updated on