This section provides a quick snapshot of the strategy’s overall performance and key statistics during the selected evaluation period.
Key Metrics
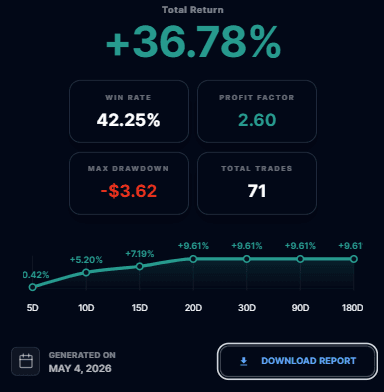
- Total Return: Represents the overall percentage gain or loss generated by the strategy. Gives a high-level view of profitability across the full test duration.
- Win Rate: Percentage of trades that closed in profit. Indicates how frequently the strategy produces winning trades.
- Profit Factor: Ratio of total profits to total losses. Helps assess whether gains outweigh losses over time.
- Max Drawdown: The largest decline in equity during the backtest. Reflects the maximum risk or loss experienced.
- Total Trades: Total number of trades executed during the test period. Helps understand the scale and activity level of the strategy.
- Time Range Performance (5D → 180D): Displays performance across different time intervals. Helps evaluate how the strategy performs over short-term and long-term periods. Useful for identifying consistency and stability.
Equity Trend Graph
- Visual representation of returns over time.
- Highlights growth, decline, and drawdown patterns.
- Helps quickly assess performance trends.
Report Download
- “Download Report” option allows exporting the full backtest results.
- Useful for sharing, analysis, or record-keeping.
Last updated on